Home » Planning

Category: Planning

Map with Geocoding

What If You Could Create “What-If” Scenarios?

https://www.complexbuilders.com/?buy=7008 School district superintendents and planners have tough decisions to make when school facilities are not being utilized efficiently. Having data and solid plans to back those decisions up is essential. If you could plan for change in your district using what-if scenarios, what might those look like?

If, for example, you needed to consider closing a school because your district’s enrollment has been dropping, you might first open a map of your district and school boundaries on your computer. (A note: not all districts have accurate school boundaries on a computerized map. So, just having this would be a huge first step.)

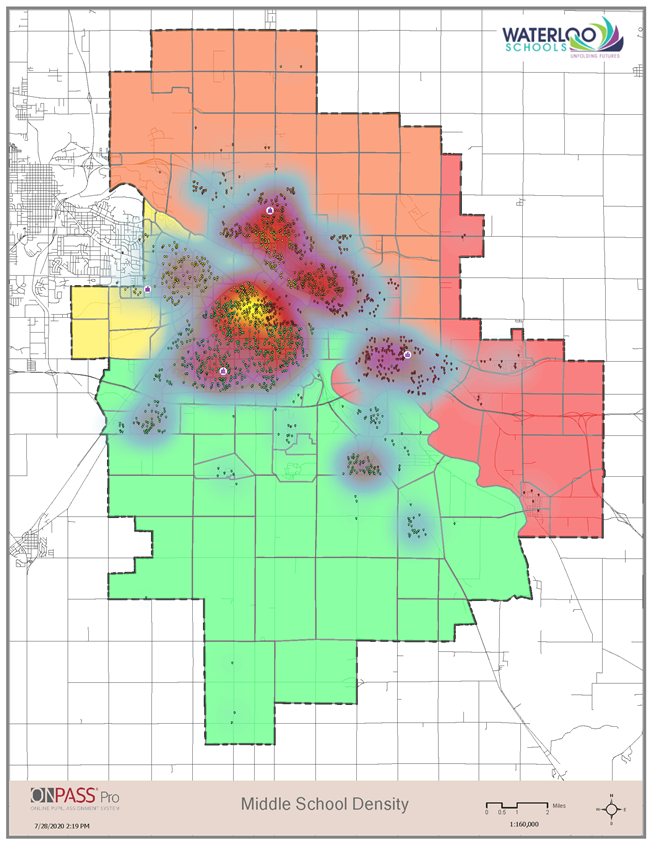
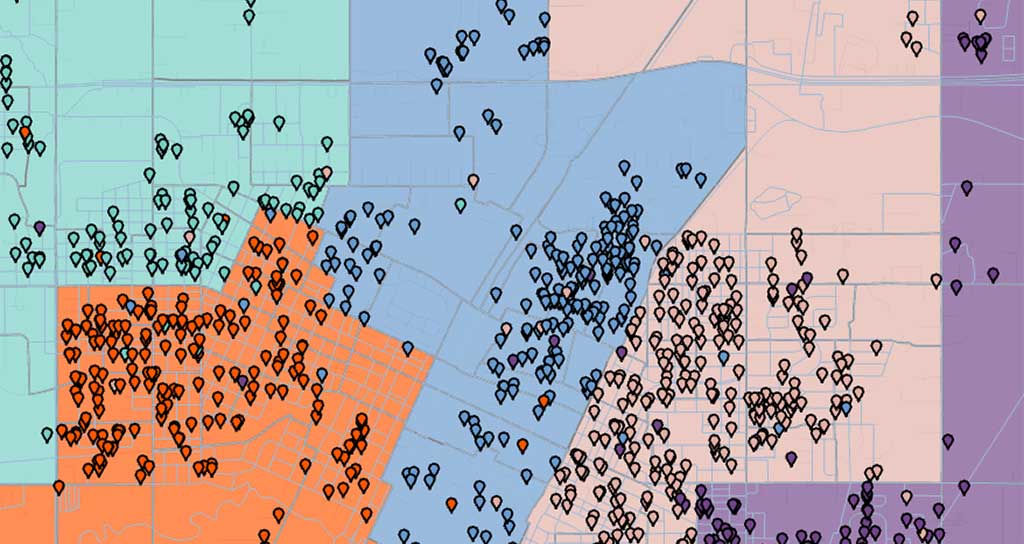
This map would show your school attendance boundaries and a dot on the residence of each student enrolled in the district. (This is called geocoding—a geographic marker that represents a student.)

Plus, you would have a numeric chart with counts of the number of students at each school broken down by grade and demographic category, such as ethnicity, program participation, primary language, and special education. Ideally, you would also have the school capacities, percent utilization, and seats available at each school to tell you which schools are under and which are over capacity, and by how much. Even better, these numbers would all change dynamically when you make a change to your boundaries.

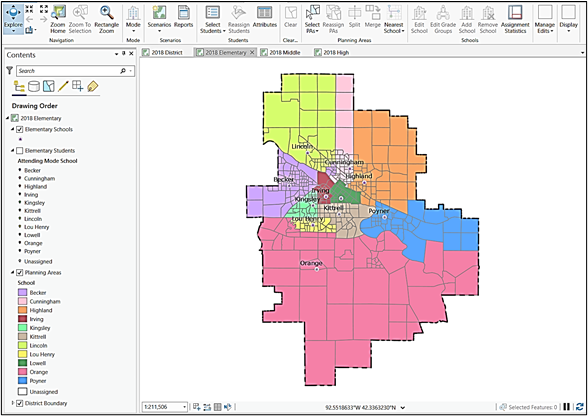
In a what-if scenario, to simulate closing a school, you would simply delete the school icon from your online map and see that the area around the school and all the students who live in that area are no longer assigned to a school. You would click a button to select the unassigned planning areas and assign them to other schools. You would check your chart to see the impact on enrollments at the remaining schools. You would study the results and reassign some areas to different schools until enrollments are within school capacities and ethnicities and other demographic and special program variables ensure equity across schools.

That’s what we mean by what-if scenarios. Are you equipped with the technology to do this type of district planning with a few clicks of the mouse? If not, you can get there by employing a geographic information system, or GIS, planning system for your district.

School districts face numerous situations that require careful and thoughtful planning. By using what-if scenarios, you can simulate changes and get the data and maps you need to present multiple options to your board, families, and the public, particularly important when tough decisions must be made.

Here are a few other what-if scenarios a GIS planning system can help with:

What if you wanted to simulate opening a new school to accommodate increased student enrollments?

What if you wanted to look at changing grade configurations (e.g., K–8 to K–5 or 9–12 to 10–12, etc.) to continue to utilize all your sites, but even out student enrollments across buildings?

What if, after an emergency, such as a fire in a large neighborhood that crosses multiple elementary, middle, and high school attendance areas, you wanted to provide targeted support to families and schools? Could you easily and quickly create an emergency call and mailing list of all the families impacted? If the neighborhood school is no longer operational, could you also quickly assign those students to their next closest school with capacity?

What if the board asked about changing feeder patterns from elementary to middle to reduce the distance students travel to school? Could you give them viable options?

What if you could increase capacities at schools by bringing in portable classrooms delaying the need to build, while monitoring the effect on enrollments of new houses being built within district boundaries?

What if the district had uneven growth with some areas experiencing declining and other areas increasing enrollments? Could you easily review options to modify school attendance boundaries to not only even out enrollments across schools, but also ensure equity for all student populations and program participants?

A GIS planning tool gives you the power to create multiple what-if scenarios to address a variety of situations and decisions you might be facing or will face in the future. The planning should be the easy part so you can spend your energy and time working with the people who will be affected by your decisions.

Planning for School District Demographic Change During a Pandemic

Planning for School District Demographic Change During a Pandemic

By Caroline Fahmy

It is no exaggeration to say that the COVID-19 pandemic has created a chaotic environment for school district administrators particularly in managing student enrollments. School districts should start collecting and analyzing demographic data now to understand and plan for necessary changes in their districts next fall.

Public school enrollments are dropping around the country, and no one knows where, whether, and when school districts will see those students in seats1. Other pandemic-related demographic changes could have far-reaching implications for school enrollment. A survey by the Pew Research Center found that,

Among those surveyed in early June, 3% say they themselves moved permanently or temporarily due to the coronavirus pandemic, and 6% say someone moved into their household because of it….An additional 14% of those who did not personally experience relocation say they know someone else who moved2.

Enrollment analysis is also complicated by shifts of students into private schools. After an initial flurry of private school closures at the start of pandemic-related shutdowns, it seems that more families are choosing private schools with face-to-face options when their public schools offer only online classes3. It is unclear whether the students will return to public schools when the school districts offer more in-person instruction.

In these circumstances the only survivable posture for a state or school district is to acknowledge uncertainty. That means preparing for multiple scenarios, not just one4.
Paul Hill, writing for the Center for Reinventing Public Education

One thing the pandemic has demonstrated is that schools can be successful at adopting technology to meet rapidly changing circumstances. Geographic information systems (GISs) such as ONPASS® Pro include tools to help school districts manage uncertainty by creating planning scenarios based on local data. Will your district need to close a school? Change the location of educational programs? Adjust attendance boundaries? With a GIS in place in your district, you can create multiple planning scenarios to meet your unique needs, especially over time as demographics across the district change.

Putting GIS technology in place now will give you a head start on planning for next fall. A GIS is a specialized data base that combines many different types of information using location as the key. The ability to analyze existing data is consistent with expert advice about school district planning, even in non-crisis situations.

Brian Eschbacher, former executive director of planning and enrollment services for Denver Public Schools, points out that successful districts…

link academic outcomes with data related to sustainable enrollment levels, facility condition and capacity, and choice patterns. They disaggregate student data by socioeconomic status, race/ethnicity, native language or special education status to reveal changing patterns in student needs and achievement. More sophisticated districts are attuned to varying dynamics of different regions or neighborhoods within the district5.

Enrollments and the demographic makeup of schools may never return to what they were before the pandemic so having a GIS planning tool in place now will be crucial to addressing challenges in the months and years to come.


Footnotes

1) https://www.npr.org/2020/10/09/920316481/enrollment-is-dropping-in-public-schools-around-the-country
2) https://www.pewresearch.org/fact-tank/2020/07/06/about-a-fifth-of-u-s-adults-moved-due-to-covid-19-or-know-someone-who-did/
3) https://www.cato.org/blog/why-not-more-private-school-closures-increasing-evidence-suggests-theyre-offering-person
4) https://www.crpe.org/thelens/restoring-public-education-post-covid

How To Use a GIS Consultant

How To Use a GIS Consultant

A geographic information systems (GIS) is a powerful relational database that stores, relates, manipulates and reports data, but it also includes a geospatial or mapping component. Where a relational database presents data in tables, graphs and charts, a GIS does that plus it stores points, lines, and polygons that can be presented on maps.
How To Use a GIS Consultant
GIS is not a new science—it actually got its start back in the 1960s—but in the last decade or so, it has become more and more common in our everyday lives. For example, we use GIS applications on our phones to lookup routes and tell us how long it will take to walk, ride a bike, or drive there. We find gas stations, stores and restaurants in relation to where we are. We go to maps online to find out more about things like the spread of disease, available resources by area, and wildfires. Maps mixed with dynamic data are an effective way of communicating important trends and information, helping to answer questions and revealing patterns and relationships in data we may not otherwise see.

There are many GIS applications from which to choose, some are free and open source. But effective use of software—even free or low-cost software—requires resources that may not be available and an ongoing need that would justify the investment in an inhouse GIS system.

A GIS consultant is an effective alternative.

How To Use a GIS Consultant
To setup the GIS to answer questions specific to your district or organization, your consultant will need to customize the GIS with your data. Data elements include points, lines, and polygons that lay on top of your geography—translation: buildings, bus stops, food pickup centers, childcare centers, students, clients, etc. (points), and boundaries of your district and internal zones such as school attendance areas or wards (lines and polygons). You will need to work closely with the consultant initially to get your data loaded. The process of inputting your points, lines, and polygons into the GIS is involved and something they specialize in so you can leave that in their hands.

Once your data is loaded, the GIS opens a world of possibilities: just ask the questions and see what answers are to be found.

  • Where do our bilingual students live in relation to our schools with bilingual programs?
  • To which other schools should we assign students who attend School X that we plan to close?
  • Where is the best location to build a new school given the growth in our student population?
  • How do we ensure we maintain equity of services and education and minimize student travel time?
  • What will be the effect on our school attendance numbers if we allow/do not allow inter- and intra-district transfers?
  • How can we identify client addresses who live within our service zones so funding can be properly allocated?
  • What would be the effect on bussing costs and student travel time if we increased our walk-ride buffer from one-half mile to one mile around each school?
  • Where do the students live who did not show up to school and what is the quickest way we can send staff out to do a personal visit?
  • What households are affected by the flooding (or fire or earthquake, etc.) in the east side of our district?
  • What would be the effects of changing our school boundaries to address inequities in educational services? And, how do we best communicate the changes to the boundary lines?
  • What would we see if we overlaid a map of Internet services over our students’ residences? Is there anything we can do to improve Internet access and service in poorly covered areas?
  • What would we see if we overlaid a map of crime data over our students’ residences? Is there anything we can do to help with student transportation in these areas?

The questions and answers are almost endless. Find a GIS services company that will input, store, and maintain your district or organization’s geospatial data into a GIS and then remember to consider the geospatial aspects when challenged with communicating information to your stakeholders, evaluating options, and asking what-if questions.

How To Use a GIS Consultant

Geographic Information Systems: Where’s the Added Value for School Districts?

Susan McMillan, September 2020

At Educational Data Systems, we believe that geographic information systems (GIS) provide school district administrators with a key that unlocks efficiencies in using existing data.

If you are like many superintendents, your daily leadership tasks fall into roughly three categories: educational, political, and managerial1. Which tasks occupy most of your time likely depends on the size of your district and whether it is urban, suburban, or rural.

No matter your circumstances, effective leadership requires that you use data analysis to inform your decision making.  Assessment, budget, facilities, labor contract data…the list goes on and on. Given the potential for data overload, adding geographic information to the mix may feel both overwhelming and irrelevant to your daily tasks.

However, geography is more than a physical location. It combines location with physical and/or cultural attributes (characteristics) associated with that location2. According to GIS-industry leader Esri, all aspects of a school or a district have a “geography”3. School buildings and bus shelters have a “fixed” geography. Students and buses have a “mobile” geography.

Geographic information systems (GIS) created specifically for school district planning use location as the key to merge data from various systems across the district.

Where’s the GIS Benefit for Educational Leadership teams?

Focus on Equity. With geographic data, leaders can analyze the location of educational programs in relation to where student needs are greatest. Your SIS data in a GIS—which functions as a relational database—will show not only who your students are, but where they are, and whether they all have access to high-quality educational programs and facilities, regardless of demographic sub-group.

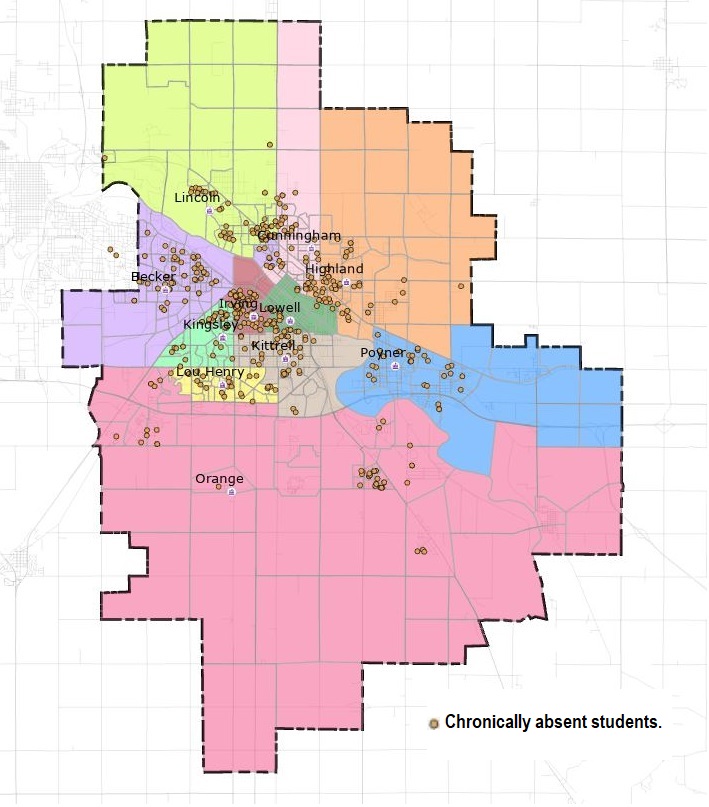
Improve Achievement. Understanding all the factors that contribute to student academic success is an ongoing and data-intensive project. Chronic absenteeism is one factor that is negatively associated with student academic achievement4. With geographic information tied to student-level attendance data in a GIS, you can map the data and see where those students live, as in Figure 1. The map can show where targeted interventions are likely to be most effective.

How To Use a GIS Consultant
Figure 1.

Communication. Day-to-day operations are more efficient with GIS tools. Schools districts with interactive school locator maps on their websites communicate which schools children will attend based on address, and can incorporate many other pieces of information relevant to the community.

GIS tools also add capacity for district leaders to use data to support change. Changing school boundaries, permanently closing a school building, opening a new school, and reconfiguring grade levels are politically challenging processes. The data needed for these difficult decisions can be overwhelming when presented in table after table. Further, discerning patterns from tabular data is challenging, even for experts who are familiar with the data.

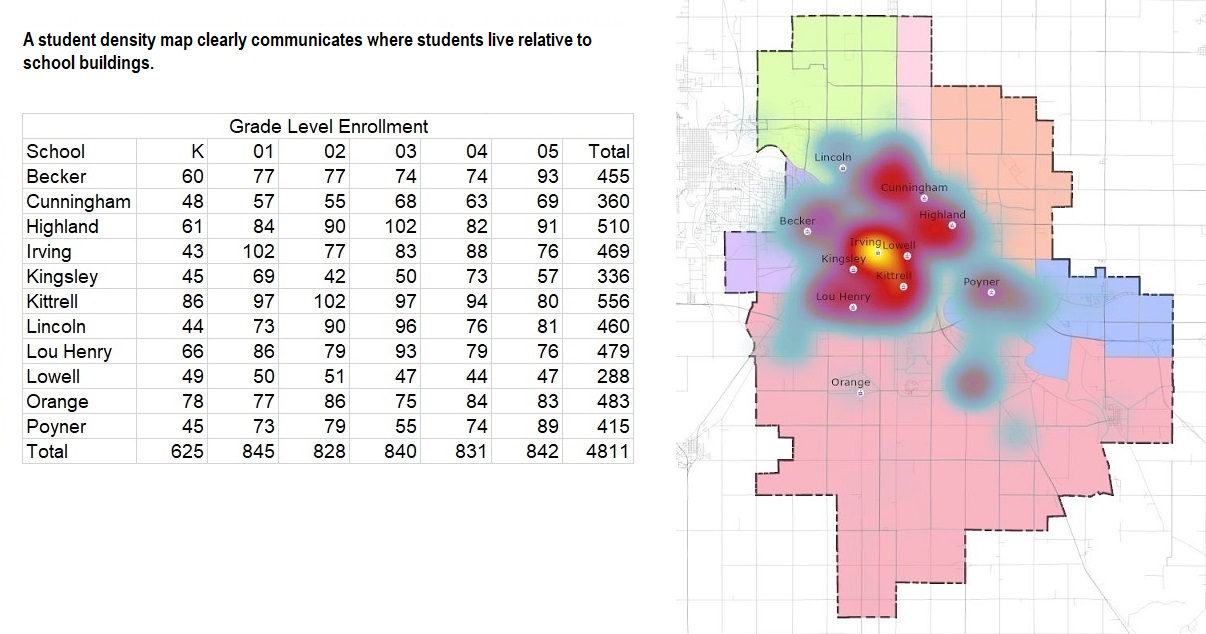
Easy-to-interpret maps are an effective way to mitigate the data overload problem and communicate patterns. The map in Figure 2 shows the geographic distribution of students relative to schools; information that is simply not available in the enrollment table.

Table Plus Density Map
Figure 2.

When your data are in a GIS, you can use location information to demonstrate to your community why change is necessary and to model alternative scenarios. Districts that use GIS find that they can answer questions quickly and efficiently “in-house” rather than paying outside consultants.

Answer a whole new set of questions. Combining location data with other school district data in a GIS gives leaders the ability to answer questions that are not easy to answer without location information. Examples include:

  • Where do we have buildings with spare capacity?
  • Where are our buildings that are overcapacity?
  • Where should we target funds for improvements?
  • Do we need a new school? If so, where should it be located?
  • Do we need to close a school? Which one?
  • What is the best way to assign students to schools using my district’s criteria?
  • What threats to safety are near our schools (e.g., railroad tracks, major roads, flood zones, earthquake fault lines, distance to fire station)?
  • Where are the students most likely to need help recovering from a disaster or emergency?

If you are a school district administrator drowning in data, GIS tools provide an organizational principle that will help you use all of your data more efficiently.


Footnotes

1) contextual influences on superintendents’ time usage, https://epaa.asu.edu/ojs/article/view/390/513

2) https://www.nationalgeographic.org/activity/characteristics-of-place/

3) http://downloads2.esri.com/edcomm2007/syfr/pres/7-Syfr-ESRI-2009-Administration.pdf

4) https://www.epi.org/publication/student-absenteeism-who-misses-school-and-how-missing-school-matters-for-performance/

What is a GIS Map? First let’s define GIS

What is a GIS map?

First let’s define GIS, and who better to do that than National Geographic1:

A geographic information system (GIS) is a computer system for capturing, storing, checking, and displaying data related to positions on Earth’s surface. GIS can show many different kinds of data on one map, such as streets, buildings, and vegetation. This enables people to more easily see, analyze, and understand patterns and relationships.

With GIS technology, people can compare the locations of different things in order to discover how they relate to each other. For example, using GIS, a single map could include sites that produce pollution, such as factories, and sites that are sensitive to pollution, such as wetlands and rivers. Such a map would help people to determine where water supplies are most at risk.

A GIS map is a scientifically accurate computerized map that is fit onto a known coordinate system of latitude and longitude values and stored in a GIS. We carry around GIS maps with us every day on our smart phones. Google Maps, Mapbox, Waze, and Apple Maps are all examples of GIS maps.

These map applications have changed the way we navigate ourselves around town and how we look up and find resources. They have changed our expectations for accuracy of and access to location information. We expect immediate access and complete accuracy because we rely on them for so many important things. (And, we really don’t have time to get lost driving around!)

Your school district is no different. Parents and students, administrators, staff, and the public all need and rely on location information that is unique to your district.

It might surprise you to know how difficult it is, generally, to find district and school boundaries on district websites. Some districts have lists of schools but no maps. Some maps are outdated. Some are drawn on paper and then scanned to a PDF. Local information overlaid on district maps is mostly not available.

We will make a bold statement here: Every school district needs a GIS map—a map of boundaries, attendance areas, and sites precisely plotted with accurate geographic features and points of interest. Ideally, to support parents and students, the GIS map would also show local information, such as student bus stop locations, school sports venues, childcare and after-school centers, school board areas, and even local fresh food sources, shelters, public sanitation stations, and food kitchens, overlaid within the district’s boundaries.

Here are just a few uses of GIS maps:

  • Share accurate boundaries across partnership organizations (e.g., city, county, or disaster agencies).
  • Contribute content for decision making and presentations in administrative and board meetings.
  • Provide spatial data for future boundary planning and boundary adjustments.
  • Provide school assignments and possible alternate school choices to parents.
  • Present as graphics in reports and documents.
  • Provide location information, points of interest, and special zones (e.g., board areas) within the district.
  • Combine display methods (e.g., maps, data tables, pictures, charts) in one system for more complete information.
  • Analyze future trends by modeling time series data.
  • Use in online and desktop GIS software applications.
  • Provide an easy-to-use self-serve school look-up for parents and the public.
  • Use for “what-if” scenarios to look at possible policy changes.
  • Look for patterns and relationships in district, school, and student data to develop programs and interventions that positively impact student success.

The science and technology are here and there is no reason school districts — organizations that are geography based — should be using imprecise, outmoded, or outdated maps.


Footnotes

1) GIS in National Geographic’s Resource Library

Google Maps, Mapbox, Waze, and Apple Maps are tradenames and the property of their respective owners.