Home » Planning » Boundary Planning

Category: Boundary Planning

School District Planning and GIS Resource Roundup 2019 | Educational Data Systems

School District Planning and GIS Resource Roundup 2019

Our Planware division staff members are always on the lookout for web resources related to the broad topic of “school district planning”. We are particularly interested in articles and reports that demonstrate how maps help visualize complex data and how geographic information systems (GIS) improve planning processes. This blog provides a list of websites related to school district planning, maps, or geographic information systems (GIS) that caught our interest in 2019. We hope you will find these links helpful, and Happy New Year!

Plan a successful school district response to enrollment changes. Brian Eschbacher is the former executive director of planning and enrollment services for Denver Public Schools. In this article for The 74 Million, he presents concrete tips for improving school district responses to enrollment changes. The discussion includes how to tackle tasks as diverse as budgeting and opening new schools or closing existing schools, and tips for who (superintendents, board members, partner organizations) should do what to smooth the planning process.

Use GIS for emergency preparedness planning. School safety is a hot topic as natural and man-made disaster frequently top electronic and print news feeds. GIS applications include tools—such as maps of hazards and disaster risk—that help with preparing for and responding to disaster. This guide to Emergency Preparedness in School includes a natural disaster risk map and many links to resources related to disaster planning and response.

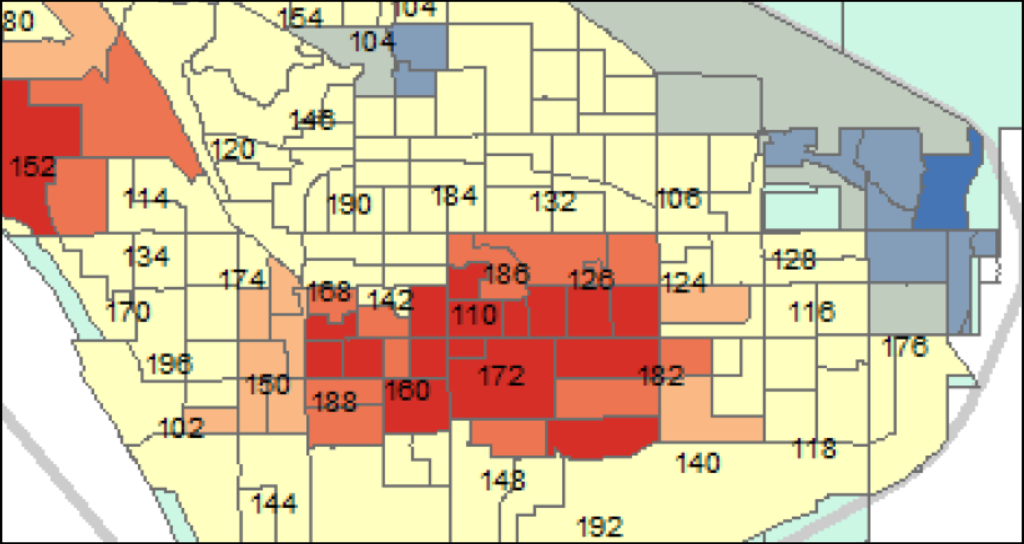
Chronic absenteeism data stories. The US Department of Education has published an online report titled Why Chronic Absenteeism Matters: What the Research Says. The report includes data comparisons for demographic sub-groups, a section on the “Geography of Chronic Absenteeism”, and an interactive map that is a powerful data visualization tool. A separate article published by EdSource provides an interactive map with details of chronic absenteeism in California.

The geography of opportunity. The Opportunity Atlas used US Census data and anonymized longitudinal data on 20 million Americans to develop a “…new interactive mapping tool [that] presents estimates of children’s chances of climbing the income ladder for every 70,000 neighborhoods across America.” The interactive mapping tool provides evidence about where and for whom opportunity has been missing. The hope is that the information will be used to develop local solutions “to help more children rise out of poverty.”

Maps are for more than physical features. Things on maps such as buildings, roads, or lakes are referred to as “features”. In school district planning, it’s easy enough to think of mapping the locations of school buildings, student homes, and bus stops, to name a few examples. An intriguing article by Chris Wayne titled How Do We Capture Culture on a Map?, explores how maps can display empirical data related to the less tangible and less durable things that are defined by people.

2018 Planning and GIS Resource Roundup

2018 Planning and GIS Resource Roundup

The end of the calendar year provides an opportunity to reflect on resources that we’ve found useful, intriguing, or beautiful. This blog provides a list—in no particular order—of five websites related to school district planning or geographic information systems (GIS) that caught our interest in 2018. We hope you will find these links helpful, and Happy New Year!

School District Planning. Facilities management at school districts has long been a place-based process. Advances in GIS tools present opportunities for districts to blend geographic data with other sources of information. Broward County, FL has been a leader in using GIS for data analysis and presentation. Their website offers excellent explanations for how GIS is useful to the school district in general and district planning in particular.

Desegregation. Desegregating public schools continues to be a hot-button issue in the US. This heavily researched article by Alvin Chang discusses how school attendance boundaries contribute to, or mitigate, segregation based on neighborhood patterns. The interactive maps and charts provide eye-opening visuals, and the article includes plenty of links to the supporting research.

Cartography. In “Storytelling with Maps on Paper and Screen,” cartographer Allen Carroll discusses the differences between maps for printing and maps for display on screens. Beautiful maps accompany the text to illustrate his conclusion: …print provides the luxury of space—of presenting lots of fine detail across the expanse of a sheet of paper—while digital gives us the advantage of time, enabling us to unfold a narrative along the razor-thin membrane between past and future.

Enrollment Projections. School district administrators in multiple departments must rely on enrollment projections in order to make effective plans for the future. Districts also need to keep an eye on nation-wide demographic trends. The National Center for Education Statistics provided a 2018 update with projections by region and state.

Citizen Science Projects Using Maps. As school districts continue to implement the Next Generation Science Standards (NGSS), educators may find citizen science projects engaging and useful for students. This article by Diana S. Sinton for Directions magazine provides many links to citizen science projects that involve mapping applications.

Eddata Word Cloud

Is School Boundary Redistricting in Your Future?

By Susan M. McMillan, Ph.D., Senior Statistician and Researcher

Our family moved to Eden Prairie, MN during the middle of the 2011—12 school year. On an ice crystal-cold morning in January, I was pleasantly surprised to discover that a school bus would collect my boys at our corner. When we decided which house to purchase we had been under the impression that our family fell into the “walker” category because we lived only a few blocks from an elementary school.

The pleasant feeling faded as the other parents at the bus stop abandoned their “Minnesota nice” roots and described the acrimonious year-long redistricting process that had sent our neighborhood kids to a school about 1 and a half miles away. Read more

Why Map Data?

Why Map Data?

By Caroline Fahmy, President and CEO

Since our company’s inception, our Planware division has used geographic information systems (GIS) to view data. Our GIS software applications and services have helped map school district boundaries and model changes in school attendance areas. Using maps to model changes in the district’s geography (e.g., new streets or subdivisions) or student population (e.g., growth or decline in one or more areas of the district) assists school district planners in making decisions about how to utilize their school facilities more efficiently and, ultimately, better meet students’ needs.

Read more