Home » Planning » Page 2

Category: Planning

Geographic Information Systems (GIS) Guided this School District’s Crisis Response

Geographic Information Systems (GIS) Guided this School District’s Crisis Response

“Geospatial information has been proven effective in supporting both the understanding of and response to disasters….However, the ability to effectively share, use, and re-use geospatial information and applications…is dependent upon having the required partnerships, policies, standards, architecture, and technologies already in-place when disaster strikes1.”

The COVID-19 pandemic shutdown of schools has been described widely as “unprecedented,” but district administrators routinely face challenges that are perhaps more aptly described as “everyday” disasters, or operational crises that need an immediate response.

Eric Wells, Chief Information Officer at Muskogee Public Schools in Oklahoma is part of a school district administrative team that faced several crises this past school year, not all of them COVID-19 related. District Administration recently published an article by Eric, How GIS guided one district’s crisis response.

The article highlights benefits of having a GIS application in place to meet operational challenges. The administrative team was able to use ONPASS® Pro, a specialized GIS application that contains detailed district, school site, and student location data, to overcome several types of operational challenges.

Prior to the COVID-19 shutdown of schools, a sewer line break at one of their school sites caused an immediate need to reassign 300 students to a different school with as little educational time lost as possible. In one afternoon, the team was able to reassign students to the closest school that had capacity and met students’ educational programming needs.

ONPASS Pro also proved useful in responding to the COVID-19 crisis. The district needed to be sure all children qualifying for free breakfasts and lunches were receiving food while schools were shut down. Many students ride the bus to school so just having food available at school sites that are miles away from their homes was not enough. Using existing bus stops and other neighborhood spots as drop-off locations, the school district used ONPASS Pro to determine where to take food to families, allowing them to be served within walking distance of their homes.

Reliable internet connections also became critical for student success during the COVID-19 shutdown and the transition to remote learning. Because the district already had geocoded student-level data in ONPASS Pro, the administrators could provide student location information to its T-Mobil telecommunications vendor. The carrier was able to increase cell tower capacity and speed to ensure that every student throughout the district had equitable access to technology.

For more details, read the full District Administration article, and watch this video to see how Eric Wells has been successful using ONPASS Pro to plan for other types of potential disasters.


Footnotes

1) https://www.ogc.org/projects/initiatives/disasterscds

Photo by USGS on Unsplash.

How to Correct School District Boundary Issues

By David Johnston, Manager, Geographic Information Systems

Have you ever thought about your school district’s boundaries—the outer district and interior school attendance boundaries? Most people don’t give them much thought except when it comes to buying a house or when the attendance zone (or catchment area) boundaries need to be changed.

Given the justifiable focus on factors that contribute directly to student success, it is easy to forget that school district administrators manage “geographic entities”1. Everything about a school district is related to geography: a location or geographic area with physical and cultural attributes.2

Students, for instance, have a home address, a school address, and attributes such as gender, ethnicity/race group, socioeconomic status, grades, attendance, educational program participation, and special needs. The district has exterior boundaries that distinguish the geographic area from surrounding districts, and often has interior boundaries for school attendance zones.

Where do digital school district boundary files come from?

The US Census Bureau takes a survey every 5 years as part of its Census of Governments.

The Census Bureau collects school district boundaries to develop annual estimates of children in poverty to help the U.S. Department of Education determine the annual allocation of Title I funding to states and school districts. NCES also uses the school district boundaries to develop a broad collection of district-level demographic estimates from the Census Bureau’s American Community Survey. The Census Bureau annually updates school district boundaries, names, local education agency codes, grade ranges, and school district levels based on information provided by state education officials3.

Even with annual updates, technical inaccuracies and/or practical problems can creep into the district and school attendance zone boundaries through time. For example, land is developed and where a boundary used to go through a field that had no consequences, now it cuts across a house.

About 30% of our clients have technically inaccurate boundaries, and we’ve never seen problem-free boundary files.

What are common types of boundary problems?
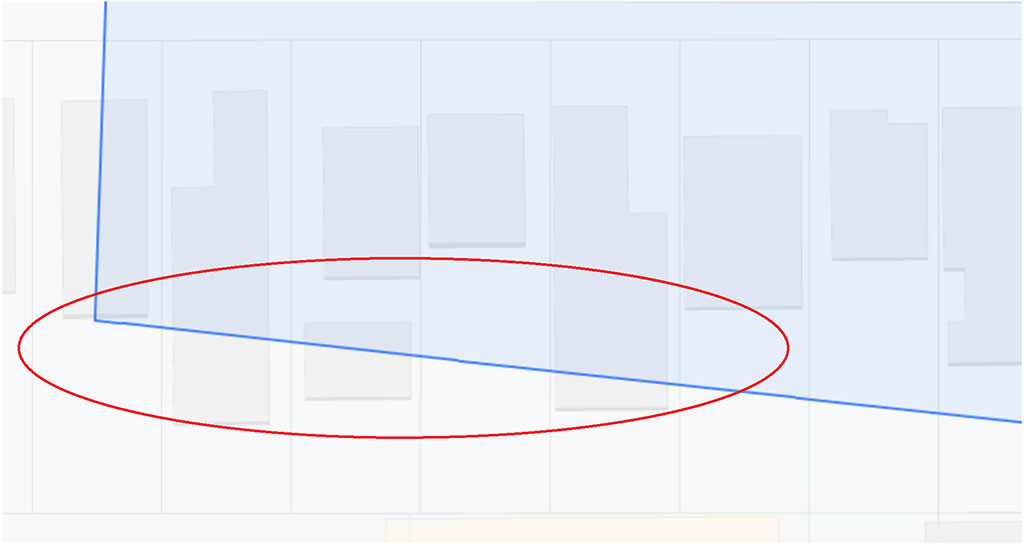
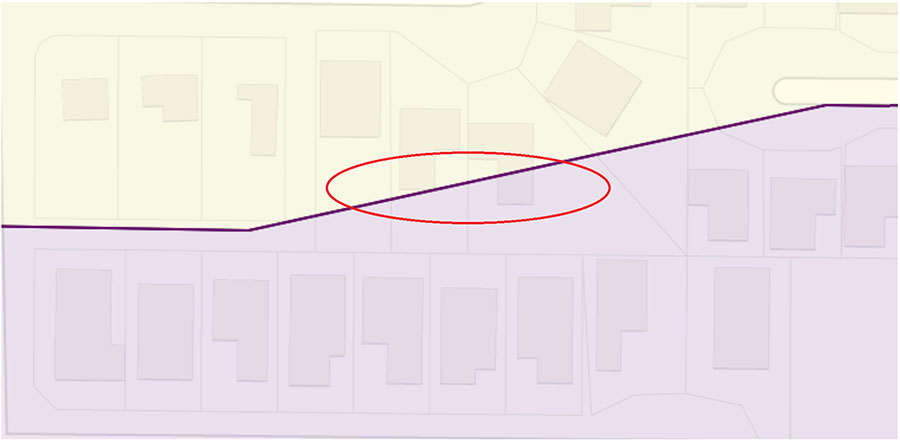
A boundary line that4:

  • Splits a house or houses
  • Creates a gap between adjacent geographic areas
  • Creates an area of overlap with an adjacent district or attendance zone
  • Doesn’t follow other line features such as roads; for example, the district includes addresses on both sides of a street

Boundary Problem 2 with Red

Problems with boundaries might feel like nuisance technicalities but they have practical importance. Accurate boundaries help ensure that:

  • Students are attending school in their assigned districts
  • Property owners are paying taxes in the appropriate district
  • Developer fees are distributed correctly
  • Information shared with other state and local government agencies (tax assessor’s office, city planners, emergency management team) is correct

How to correct inaccurate or problematic boundaries

States differ in their specific laws and regulations but in general the interior school attendance boundaries are under the control of the school district. In California for example, districts have local control and run as independent entities. They develop their own processes to adjust their schools’ attendance boundaries. Decisions generally involve the community and are made by the local school board. In some districts, adjustments can be made by administrative decision.

The outer district boundary is another story. Because the outer boundary of a district is coterminous with other districts’ boundaries, a single district does not have control over its own district boundary. Each state has detailed regulations about how boundary changes must be made. At a minimum the change process must involve the adjacent district(s). A county committee may be involved (as in California), and the state department of education often holds final change-making power.

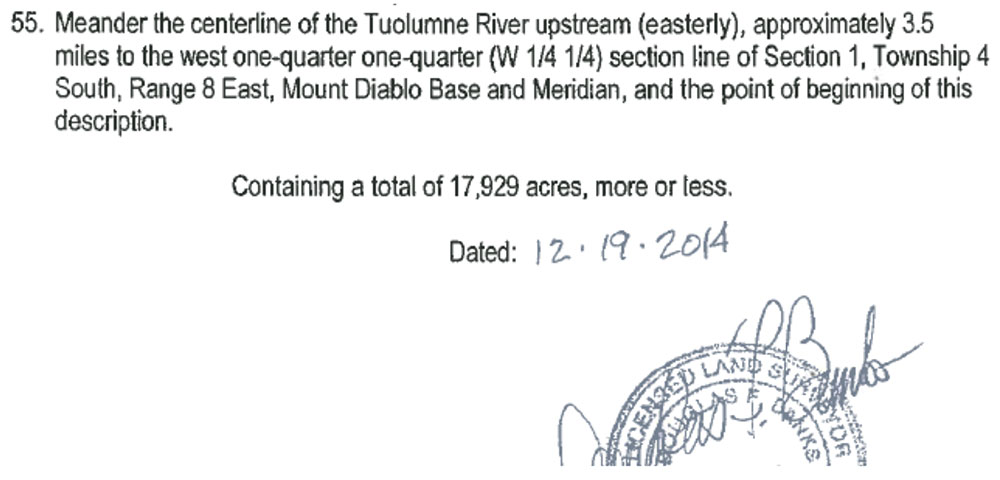
Changes to your district boundary lines will mean that the written legal description – which is opaque and not useful for most practical purposes – must be updated, and new maps filed. Updating the written description is a job for experts: lawyers and surveyors.

Example Boundary Description

Similarly, creating corrected maps is a technical problem that geographic information systems (GIS) experts can solve. The GIS specialist will start with the Census Bureau/NCES digital file, identify technical inaccuracies or other problems, and proceed with making corrections within the guidelines of local and state regulations. The corrections process can be lengthy if it involves neighboring districts, but the GIS expert cannot make unilateral decisions about where the correct boundary line is drawn.

School districts that have their boundaries and their school and student attributes in a GIS application are able to monitor their boundaries, prevent school attendance boundary problems when new housing is built, and make corrections as soon as possible when problems arise. They can also provide accurate digital files to the state and US Census Bureau.


Footnotes

1) https://nces.ed.gov/programs/edge/Geographic/DistrictBoundaries
2) http://downloads2.esri.com/edcomm2007/syfr/pres/7-Syfr-ESRI-2009-Administration.pdf
3) https://nces.ed.gov/programs/edge/Geographic/DistrictBoundaries
4) https://www.ncbi.nlm.nih.gov/pmc/articles/PMC5693243/

School District Planning and GIS Resource Roundup 2019 | Educational Data Systems

School District Planning and GIS Resource Roundup 2019

Our Planware division staff members are always on the lookout for web resources related to the broad topic of “school district planning”. We are particularly interested in articles and reports that demonstrate how maps help visualize complex data and how geographic information systems (GIS) improve planning processes. This blog provides a list of websites related to school district planning, maps, or geographic information systems (GIS) that caught our interest in 2019. We hope you will find these links helpful, and Happy New Year!

Plan a successful school district response to enrollment changes. Brian Eschbacher is the former executive director of planning and enrollment services for Denver Public Schools. In this article for The 74 Million, he presents concrete tips for improving school district responses to enrollment changes. The discussion includes how to tackle tasks as diverse as budgeting and opening new schools or closing existing schools, and tips for who (superintendents, board members, partner organizations) should do what to smooth the planning process.

Use GIS for emergency preparedness planning. School safety is a hot topic as natural and man-made disaster frequently top electronic and print news feeds. GIS applications include tools—such as maps of hazards and disaster risk—that help with preparing for and responding to disaster. This guide to Emergency Preparedness in School includes a natural disaster risk map and many links to resources related to disaster planning and response.

Chronic absenteeism data stories. The US Department of Education has published an online report titled Why Chronic Absenteeism Matters: What the Research Says. The report includes data comparisons for demographic sub-groups, a section on the “Geography of Chronic Absenteeism”, and an interactive map that is a powerful data visualization tool. A separate article published by EdSource provides an interactive map with details of chronic absenteeism in California.

The geography of opportunity. The Opportunity Atlas used US Census data and anonymized longitudinal data on 20 million Americans to develop a “…new interactive mapping tool [that] presents estimates of children’s chances of climbing the income ladder for every 70,000 neighborhoods across America.” The interactive mapping tool provides evidence about where and for whom opportunity has been missing. The hope is that the information will be used to develop local solutions “to help more children rise out of poverty.”

Maps are for more than physical features. Things on maps such as buildings, roads, or lakes are referred to as “features”. In school district planning, it’s easy enough to think of mapping the locations of school buildings, student homes, and bus stops, to name a few examples. An intriguing article by Chris Wayne titled How Do We Capture Culture on a Map?, explores how maps can display empirical data related to the less tangible and less durable things that are defined by people.

GIS Applications Improve School District Disaster Planning and Response

GIS Applications Improve School District Disaster Planning and Response

Natural and manmade disasters create the need for school districts to have plans in place to understand their risks, respond to emergencies, and resume normal activities as soon as possible1. Geographic information systems (GIS) software can be an important resource for disaster planning and response teams.

[GIS] is a computer system for capturing, storing, checking, and displaying data related to positions on Earth’s surface. By relating seemingly unrelated data, GIS can help individuals and organizations better understand spatial patterns and relationships.2

For school districts, investment in a GIS application provides multiple benefits with respect to disaster planning and response.

Accurate district maps. A GIS application helps maintain accurate maps of district boundaries and building locations. The maps can be shared with city or county personnel to coordinate disaster planning. A FEMA article notes that during a disaster, “Timely, accurate information displayed on a map has always been useful to emergency responders.”3 An accurate map is also useful after a disaster when the district needs to send crews to evaluate potentially damaged sites.4

Understand proximity to hazards. A GIS application can store accurate data about school building proximity to natural disaster hazards such as streams or rivers, coast or fault lines, train tracks, chemical plants, and petroleum pipelines. Location is central to understanding risk,5 and the same GIS software can store and display estimates of risk from potential hazards. The combination of proximity information with data on vulnerability or risk can yield insights about where disaster is more likely to strike.

Identify affected students and families. GIS software can be used to identify and locate students and families affected by disaster in one or more areas of the school district. A disaster can include an outbreak of disease or a pandemic, and quickly identifying exposed students is an important part of a rapid and effective response.

The power of GIS is that the application can combine geographic data with demographic data, and the combination can produce useful insights for emergency planning.6 Susan Cutter, a geography professor at the University of South Carolina maintains that, “Knowing about the landscape of…social vulnerability helps to identify which populations may need assistance in preparing for, responding to and recovering from events.”7

Evaluate capacity to reassign affected students.If one or more of your buildings is unusable after a disaster, or if you need to help accommodate students from a neighboring district, you will need information about where you have capacity to reassign students. A GIS application can tie school building capacity information to student location data to help make the reassignment process as smooth as possible. The GIS application also makes it possible to share standardized and accurate information with multiple departments, for example student services, transportation and finance.

When a disaster hits an area or the school district itself, the superintendent and district leaders are central to the response. Anticipating potential risks, planning ahead, having reliable and up-to-date data and maps, and coordinating with other authorities are all essential to a rapid and successful recovery.


Footnotes

1) See for example, Emily Brown, Natural disasters drive need to update K12 emergency plans, January 17, 2019. https://districtadministration.com/natural-disasters-drive-need-to-update-k12-emergency-plans/

2) https://www.nationalgeographic.org/encyclopedia/geographic-information-system-gis/

3) https://www.fema.gov/blog/2013-06-07/big-picture-role-mapping-assessing-disaster-damages

4) https://www.edweek.org/ew/articles/2017/11/29/8-tips-to-prepare-schools-for-potential.html

5) https://www.pewtrusts.org/-/media/assets/2017/08/fpc_flooding_threatens_public_schools_across_the_country.pdf, p.3

6) Nate Haskin, Beyond the Map: Building Competitive Advantage Through Leveraging Geospatial Data, CIOReview, Nov., 2018, p.8. https://magazine.cioreview.com/magazines/November2018/GIS/.

7) Quoted in Eric Holdeman, Nov 5., 2014, “How GIS Can Aid Emergency Management” https://www.govtech.com/em/disaster/How-GIS-Can-Aid-Emergency-Management.html

Benefits of Geocoding Student Data

Benefits of Geocoding Student Data

By David R. Johnston, GIS Manager, Educational Data Systems

A geographic information system (GIS) is a framework for gathering, managing, and analyzing data. Rooted in the science of geography, GIS integrates many types of data. It analyzes spatial location and organizes layers of information into visualizations using maps and 3D scenes. With this unique capability, GIS reveals deeper insights into data, such as patterns, relationships, and situations—helping users make smarter decisions.1

Businesses have been quick to understand the marketing advantages of GIS technology, but how can school districts benefit?

Let’s start to answer that question with an example from business—say, a restaurant. We are all familiar with online mapping applications like Google® Maps™and Apple® Maps. We can enter the address of a restaurant, and the app will then give us the restaurant’s location by putting a pin on a digital map. We can also access additional information in a GIS database such as photos of the restaurant, reviews, coupons, and any other information that has been linked to that location.

Public school districts use very different types of information, but GIS technology can link student-level data to a geographic location and reveal insights that can lead to efficient problem-solving. Districts can analyze where students live in relation to school facilities and develop solutions to challenges such as opening a new school, closing a school, reconfiguring grade levels, changing attendance boundaries, or balancing demographic groups across schools.

GIS technology connects students and their associated data to geographic locations through a process called geocoding.

What is geocoding?

Geocoding is a way of finding or seeing a location on a digital map. “Geo” refers to a map of the earth, and “coding” refers to putting a point on that map. Geocoding an address results in a set of X and Y coordinates that identifies a place on the earth where that address is located. Geocoding applications take addresses and convert them into X and Y coordinates that can be used in a GIS database.

How does geocoding work for school districts?

School districts geocode their student addresses so they can see where their students live on the map and analyze their student data geospatially, meaning in relation to where they live. The district enters addresses that are stored in their student information system (SIS) into a geocoding application, and the application returns the X and Y coordinates. The X and Y coordinates are pieces of data that can be added to student records.

Without an application that uses those X and Y coordinates and converts them to a point on a map, they are not very useful. So, once the X and Y coordinates are stored in the student records, they can be used in a GIS application that will convert them to points on a map. The GIS application may also provide tools for data analysis that combine multiple types of other data with the location information.

Ten Benefits of Geocoding Student Addresses

Geocoded addresses are used by school district administrators and planners to

  1. Double-check the accuracy of the addresses in the district’s SIS and make corrections according to the geocoded address information.
  2. Analyze transfer policies by looking at a map to see which students are living outside the district’s boundaries and which students reside in the district but are transferring to other schools within the district.
  3. Calculate the distance that students travel to school and review transportation (walking vs. riding) policies.
  4. Review school attendance boundaries to see if they are appropriately serving students living in or transferring into schools within the district, and, if needed, develop boundary change scenarios to provide data for decision-making.
  5. Analyze student counts by grade-level and review grade level configurations at schools.
  6. Analyze student demographic, program participation, and special needs data geospatially.
  7. Layer other types of data, such as economic data, crime data, and access to fresh foods over the district’s student data to see patterns, correlations, or gaps in programs or interventions that may be needed.
  8. Review feeder school patterns (i.e., elementary schools that send students to middle or junior highs, and middle or junior highs that send students to high schools) to (a) identify the nearest schools to where students live, and/or (b) review capacities and utilizations of the receiving schools by geographic areas.
  9. Help calculate enrollment forecasts using geographic areas smaller than a full school attendance area, potentially accounting for varied growth rates across the geographic area of the district.
  10. Identify students and enable communication with families who may have been affected by natural disaster.

As a school district, what do I need to do?

The district prepares a spreadsheet file of the student records from the SIS that contain at least a student ID and address. Addresses can be parsed (separated) into multiple segments (i.e., the house number, direction, street name, city, state, zip) or concatenated as one string.

Some GIS applications allow a direct connection (i.e., via an application programming interface [API]) between the district’s SIS and the geocoding application—in which case, geocoding the addresses is a more automated process than downloading and uploading data files.

Other student data such as name, gender, birthdate, program participation, race/ethnicity, test scores, and language proficiency can be included in the data file. The GIS application that uses the geocoded data can then report and analyze other student data in addition to the ID and address.

Does geocoding work for all addresses?

No, some addresses will return an error in the geocoding application. This can happen for a variety of reasons. For example, if any part of the address is incorrect or if the address is so new that it has not yet been included in the X and Y coordinate system, then the address cannot be geocoded. Large companies, like Google, Microsoft, and Apple, update their addresses and streets continually; but because streets change often, there can be gaps in their coordinate databases. Some districts’ SIS data will result in 100-percent-geocoded addresses, but others, depending on whether there is a lot of new construction in the area, may result in less than that.

What happens if an address does not geocode?

If an address does not geocode, it may need to be reviewed for accuracy and corrected in the SIS. Geocoding is a good way of checking the district’s SIS addresses and correcting them if needed.

If the street or address is correct but very new, it can be run through multiple geocoding applications to see if one of them has the new street or address coordinates in its database. If none of the available geocoding applications will geocode the address, geocoding may need to wait until later once the new streets are added and X and Y coordinates are updated.


Footnotes

1) “What is GIS?” on Esri.com