At the end of the calendar year, we invite you to start the new decade with a few of our favorite web resources from 2019. From how to help students overcome test anxiety to whether and how achievement test scores are related to later life outcomes, this blog provides a set of assessment-related websites that we hope you’ll find interesting and helpful. Happy New Year!
How to help students with test anxiety.One argument against high-stakes tests is that they create test anxiety and stress in students. Author Blake Harvard reviews research that supports “retrieval practice”– the act of attempting to recall something from memory – as an effective method for combatting test anxiety. The author cautions that while promising, the research program is relatively new, and the conclusions may be called into question by further studies.
Assessing social and emotional learning (SEL).The NCLB years of focus on statewide summative assessment scores left many parents and educators wishing for ways to assess aspects of student learning not easily captured by tests of math and reading achievement. When the Every Student Succeeds Act of 2015 (ESSA) made it possible to include other indicators of student success, social and emotional learning seemed like a good place to start. In “Time To Put an Ice Pack on the Fever for Social and Emotional Learning”, Chester E. Finn, Jr. provides tips for how to measure SEL in valid and reliable ways.
The Nation’s Report Card. The results of the 2019 administration of the National Assessment of Educational Progress were widely described as “disappointing”, with scores stagnating or declining in most states. Go straight to the National Center for Educational Statistics data source to check out the scores and download reports based on the 2019 results as well as earlier administrations.
Achievement test scores and success in life. A recent article by Dan Goldhaber and Umut Özek reviews the research on the relationship between achievement test scores and indicators of success later in life. While there is some evidence to the contrary, there is much research evidence that achievement test scores are related to later life outcomes. The article is gated ($$), but worth gaining access to if you need to understand the nuances in the research.
I’ve had multiple conversations with teachers in which their stories start, “I’m not an assessment expert.” Perhaps they are not trained measurement scientists, but teachers are experts in the content they provide, and they are experts in what happens in their classrooms. This blog offers a knowledge base to educators who want to become experts at crafting their own classroom assessments, either by compiling questions from item banks, or writing their own items.
Step 1: Define the Relevant Content
High-quality assessments begin with detailed learning objectives that state what students should know or be able to do as a result of instruction. Start with the objectives because classroom assessment results should “accurately represent the degree to which a student has achieved an intended learning outcome.”1 Content that is irrelevant to the objectives identified for a given test or quiz should not be included because it adds to the testing and grading burden without contributing information about the learning goals.
For short formative assessments—tests or quizzes used to guide instruction—spending time evaluating detailed learning objectives may feel like overkill. Yet, the objectives keep every assessment, no matter how short or long, “on track” to provide educationally useful information. Assessment items in all content areas—physical education and performance arts, as well as reading, math, science, social studies, and so on—must be aligned with learning goals for assessments to serve their intended purpose.
Step 2: Appreciate the Pros and Cons of Different Item Types
Educators may feel overwhelmed with options for types of items to include in their assessments when considering both online and paper/pencil assessment formats. Each type of item has advantages and disadvantages for classroom use, and most types of items fit into two broad categories: selected response and constructed response.
Selected-response items ask students to choose a correct response from a set of given options; examples include matching, true/false, and multiple-choice items. This type of item is also called “objective” because scoring the responses does not require judgement—either the response matches the answer key, or it does not.
Students can respond to many selected-response items at one sitting which can contribute to score reliability (consistent results), although the item quality is as important for reliability as the number of items2. And, selected response items are easy to grade, either by hand or by machine. However, the items are difficult and time consuming to write, are criticized because they offer students opportunities to be successful at guessing, and they are sometimes associated with assessment of lower Levels in Webb’s Depth of Knowledge (DOK) categories.3
Constructed-response items ask students to produce some writing or other demonstration of knowledge. Sometimes called open-ended items, examples include extended essay, problem solving, and performance tasks. This type of item is also called “subjective” because scoring against a set of criteria or a rubric involves judgement about how well the question has been answered or the task completed.
Students can provide detailed answers or solutions to constructed-response items, but grading the responses is labor intensive and subject to variation. Constructed-response items can be easier for teachers to write but guessing is not eliminated; it looks like “bluffing” in student responses. And, because students generally have time to respond to fewer prompts, it can be more difficult to get a consistent measure of student learning (though including more items does not automatically increase the reliability of the score).
Technology-enhanced items (TEI), can be either selected-response or constructed-response items and are usually associated with assessments taken on the computer, but can sometimes be converted for use with paper/pencil tests. For example, choosing “hot” text in an online assessment format is a selected-response item that would be similar to students underlining or circling the text on a paper and pencil test. Matching and sequencing are also selected-response items that can be administered on paper or online. Online assessment items that ask students to plot points and lines on graphs or generate equations are examples of constructed-response items that can also be completed using paper. Computer simulations offer online versions of performance tasks.
Step 3: Match Learning Objectives with Item Types
The decision about what types of items to include needs to combine practical concerns—such as how much time the assessment will take and how much effort grading will require—with a focus on the learning objectives. Clear learning objectives often include verbs that describe how students should be able to demonstrate learning, and those verbs provide clues about what type of item will best assess learning4.
When assessment items match well with learning objectives, both in content and in what they ask students to do, they are said to be “aligned”. Well-aligned items contribute to score validity (testing what you intend to test) because they ask students to demonstrate what they know in a way that is consistent with the objective5.
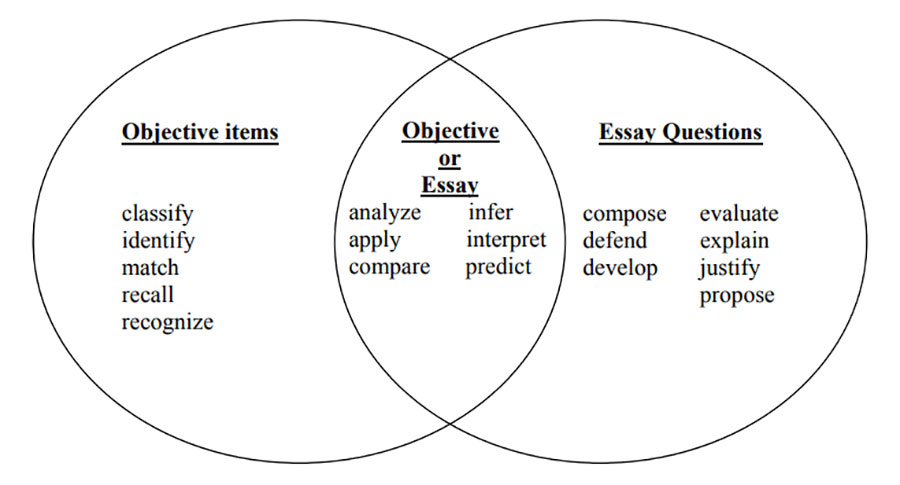
Constructed-response items are good choices when the objectives contain verbs such as “explain,” “create” and “demonstrate”. Objectives that include verbs such as “identify,” “list” and “classify” are consistent with selected-response items. Sometimes either selected or construct-response items would be appropriate, for example when the objectives include verbs such as “apply” and “understand”.
One widely cited guide to writing assessment items provides the following Venn diagram with examples for matching the verbs in learning goals with “objective” (selected-response) and “essay” (constructed-response) items.
There is danger, however, in automatically equating key verbs with item types, and this figure should be taken as an illustration. Items of any type must be structured in a way that elicits a quality response within the context of the learning objectives. Similarly, educator and blogger Robert Kaplinsky has pointed out that there is no direct translation between specific verbs and questions that assess student learning at particular DOK Levels7.
Step 4: Plan the Assessment
An assessment “blueprint” is one method for planning items and ensuring that they are covering the intended learning objectives. Blueprints are organized as a matrix with learning goals as column headers and type of item as row descriptors.
Table 1 provides an example blueprint; the numbers in the cells represent the number of items on the test. The blueprint includes only multiple-choice items to assess Objective 1, while Objective 2 is tested with multiple-choice items and one short essay, and Objective 3 is covered by two multiple-choice items and one performance task. Educators can modify this example by adding their own learning objectives, adding or deleting item types as needed, and determining how many items will be needed for each objective.
Table 1: Example Assessment Blueprint
Objective 1
Objective 2
Objective 3
Multiple Choice
5
3
2
Short Essay
1
Performance Task
1
The number and type of items needed to assess students for each objective are not set by formulas or checklists. Each objective should be covered with enough items to get a consistent (reliable) estimate of student knowledge, and that is determined by both the number and quality of the items. Items that are well-written, whether multiple choice or constructed response, reduce the amount of error associated with the measurement and provide more reliable information about what students know and can do.
Teachers must use their judgement and classroom experience to decide what mix of item types will provide the best picture of student learning in their classrooms. Educators can build assessment expertise by starting with clear learning objectives and working to align the quiz or test items, either pulled from item banks or written locally, with those objectives.
Educators routinely develop and administer classroom tests throughout the academic year. These tests are perceived as low stakes because they are often diagnostic tools and are not used to measure student growth over time or for statewide reporting purposes. However, classroom tests are important because they are used to inform instruction and curriculum development and to steer teacher professional development. Further, classroom assessments provide information to students about their educational journey. For these reasons, we believe that classroom tests should be reviewed for technical quality. Classroom assessments should provide information that is meaningful and consistent, whether teachers write the questions or put together an assessment from a commercially available item bank.
Assessment specialists use the word “item” to refer to multiple types of questions (multiple-choice, true/false, matching, constructed response, and performance task) on multiple types of assessments (graded assignments, quizzes, or tests). Item analysis is a method of reviewing items for quality and is both qualitative and quantitative.
Qualitative analysis of classroom assessment items involves teachers as content experts checking for whether the items:
Match the content standards being assessed
Are written clearly to prevent confusion
Have one correct answer (multiple-choice items)
Provide clear expectations for written answers or performances that can be graded fairly (constructed response and performance-task items)
Provide all students with the same chances for success (unbiased)
Help educators answer education-related questions about their students
Qualitative reviews happen prior to administering the items to prevent student stress when faced with confusing questions and to ensure that each item contributes to the goal of collecting educationally useful information.
Quantitative item analysis happens after the items have been administered and scored. The student responses and item scores provide numeric data that is reviewed for clues about the quality of educational information produced by each item. Assessment experts sometimes refer to “item behavior” to mean how well an item functions as an indicator of student knowledge.
Why Review Items for Quality?
The goal of classroom assessment is to understand what students know and can do and to use that information to make education-related decisions. If the items on assignments, quizzes, and tests do not contribute to that goal, they could be a waste of student and teacher time (at best) or counter-productive (at worst). Item analysis provides evidence that a test measures what it is supposed to measure and that it produces consistent results2. Reviewing item quality helps to ensure that educators are obtaining the best possible information to make instructional decisions.
Item quality is related to the length of assessments; poor quality items produce information that is not directly relevant to the content or is inconsistent about what students know. When test items are well-written and cover relevant content, educators need fewer of them to obtain consistent results. Better assessment items reduce the testing burden on both students and teachers.
One common example of how poor items complicate decision-making is that word problems on an algebra test may be measuring both algebra and English language skills. Another common example is that reading comprehension items can be measuring background knowledge in addition to reading comprehension. Educators trying to place students in algebra or reading classes would have trouble making decisions based on tests with these types of multidimensional items. The test might need to be longer to provide consistent information that answers the educational questions.
Large-scale assessment programs have psychometricians, measurement scientists, who perform highly sophisticated technical item analysis, but p-values and point-biserial correlations are quantitative tools that are available and accessible to classroom educators.
What are P-Values and Point-Biserial Correlations?
P-values provide information about item difficulty3, and point-biserial correlations, also called item-total correlations, are indicators of how the scores on each item are related to the overall test scores, often called “discrimination.”
For items that have only two score points (correct or incorrect), the p-value is the proportion of students who got the item correct. As an indicator of difficulty, it is reverse coded; a high value means the item was relatively easy, and a low value means it was more difficult. P-values range from 0.0 (no students got the item correct) to 1.0 (all students answered correctly). Interpreting p-values depends upon the purpose of the assessment and is covered in more detail in “Part 3: Interpreting Item Statistics.”
Item difficulty for items with more than two score points (for example, a constructed-response item that is scored as 0, 1, or 2) can be indicated by the “adjusted item mean.”4 The adjusted item mean is the mean item score expressed as a proportion of the total score points possible on that item. While not technically a p-value, it has the same 0.0 to 1.0 range. Our examples show items scored as correct/incorrect, and the adjusted item mean is addressed in the footnotes.
The point-biserial correlation is the correlation between the scores students receive on a given item and the total scores students receive on all other items on the test.5 The correlation will be high if students who get the item correct also have higher total test scores (minus the item in question), and students who get the item wrong also have lower total test scores. The correlation shows whether the item discriminates between students who know the material well and those who do not. The range is -1.0 to 1.0, but negative values indicate a problem with the item or the key. Interpretation of the point-biserial correlation is discussed in “Part 3: Interpreting Item Statistics.”
These two tools of classical test theory, p-values and point-biserial correlations, can be used to identify problematic items on classroom assessments. When teachers either revise or remove the items, the quality of information provided by the assessment improves.
Footnotes
1. The item analysis covered in this blog comes exclusively from classical test theory since those concepts and calculations are more accessible for educators with little formal psychometric training.
2. The technical concepts of validity and reliability as they relate to test scores are beyond the scope of this article. For a clear introduction see this article.
3. This usage should not be confused with the “p-value” in statistics, which refers to the probability of rejecting a null hypothesis. We note that more sophisticated measures of item difficulty and discrimination can be computed using item-response theory models, but classical test theory tools give reasonable estimates and are accessible to educators who may have little training in psychometrics.
4. California English Language Development Test Technical Report 2017—18 Edition, p. 64.
5. This is called the “corrected” point-biserial correlation because it does not correlate the item in question with its own score. Correlations can also be computed for items with more than two score points such as a constructed-response item with score points 0, 1, and 2, and the interpretation is similar.
Part 2: Computing P-Values and Point-Biserial Correlations
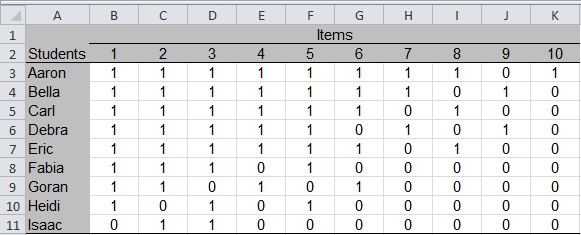
Some item banks and many learning management systems provide p-values and point-biserial (or item-total) correlations, so you may skip to “Part 3: Interpreting Item Statistics” of this blog series if you already have item statistics and aren’t interested in how they are computed. In this section, we present examples based on a fictional classroom test that is summarized in Figure 1.
Figure 1: Students and Test Item Scores
The student names are listed in rows 3 through 11 of column A, and the items are listed as the column headers (columns B through K) in row 2. All items are scored 0 if incorrect and 1 if correct. Each table cell contains the score that a student received on an item. For example, Aaron is the only student who got Item 10 correct (score of 1 in cell K3).
Computing P-Values
The p-value is the proportion of students who got an item with only two score points (correct or incorrect) correct. To compute the p-value, we need to sum the number of students who got the item correct and divide by the number of students who took the item.
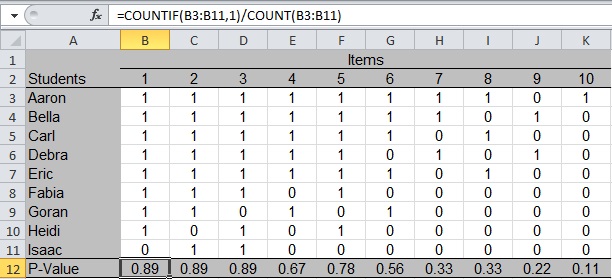
Row 12 of Figure 2 demonstrates how to compute the p-value1. The cell with a heavy black border, B12, contains the formula shown in the formula bar at the top of Figure 2. When typing into cell B12, the equals sign tells Excel to expect a formula. The formula tells Excel to count the number of correct responses (count the number of “1s” in cells B3 through B11) and divide that total by the number of students with scores (count the number of numeric values in the same range of cells).
Copy the formula into cells C12 through K12 to get a p-value for each item.
Figure 2: Computing P-Values for Items with Two Score Points
We can see that five students got Item 6 correct, and 9 students have numeric scores for the item, so 5/9 = 0.56, the value shown in cell G12. Notice that Item 10 is the most difficult (only one student got it correct), with a p-value of .11. Items 1, 2, and 3 were the easiest (eight out of nine students got them correct) with identical p-values of 0.89. Understanding how to use p-values is the topic of Part 3: Interpreting Item Statistics.
Computing Point-Biserial Correlations
The point-biserial correlation demonstrated here is the “corrected” item-total correlation; it excludes the item in question from the score total to avoid correlating the item score with itself.2 Making the correction adds a step to our process but avoids inflating the correlation.
In each figure, the formula bar at the top contains the formula typed into the cell that is highlighted with a heavy black border. The point-biserial calculation is made with the following steps:
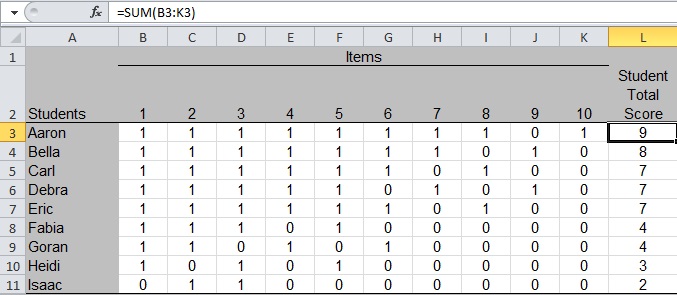
Compute the total score for each student by summing the item scores in columns B through K as shown in cell L3 of Figure 3. Copy the formula into cells L4 through L11.
Figure 3: Compute the Total Score for Each Student
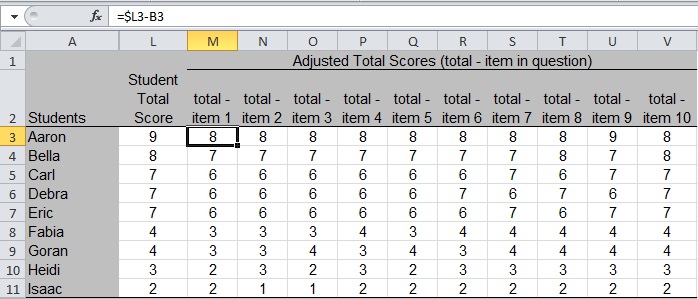
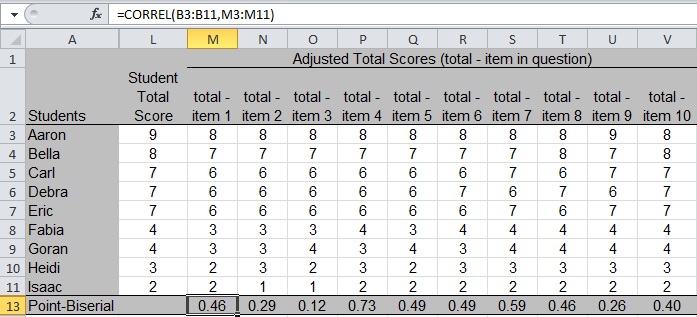
Compute the adjusted total scores by subtracting each item score from the total score as shown in cell M3 of Figure 4. (The item scores are not shown in Figure 4 for brevity; see Figure 3.) Copy the formula into cells M4 through M11 and then across the grid to fill each cell. The formula begins with “$L” to tell Excel to subtract from the value in the Total Score column as you copy the formula across columns.
Figure 4: Compute the Adjusted Total Scores
Compute the corrected point-biserial correlation using the “correl” function in Excel as shown in cell M13 of Figure 5 (the p-values in row 12 are hidden in this figure). For Item 1 (the item scores are in columns B through K in Figure 3), the formula is telling Excel to correlate the
Item 1 scores in column B with the adjusted total scores in column M, which yields a point-biserial correlation of 0.46. Copy the formula across cells N13 through V13 to fill in the values for each item.
Figure 5: Compute the Corrected Point-Biserial Correlation
In our example test data, Item 4 has the highest point-biserial correlation (0.73 in cell P13), and Item 3 has the lowest (0.12 in cell O13). Understanding how to interpret point-biserial correlations is addressed in “Part 3: Interpreting Item Statistics.”
Footnotes
1. Computing an adjusted item mean (mean item score/maximum score possible) provides an estimate of item difficulty for constructed-response items, and the range is 0.0 to 1.0, like the p-value range.
2. Whether to use the corrected point-biserial correlation is not settled among assessment experts. The uncorrected item-total correlation will generally be higher but can still be a useful indicator of item discrimination.
When educators give quizzes or tests, they need to determine whether the scores accurately reflect student knowledge or whether the scores reflect problems with the assessment items. The objective of reviewing item statistics is to identify problematic items, also called “bad,” “misfitting,” or “misbehaving” items so they can be revised or removed from scores and from further classroom use.
Items may be problematic for one or more of the following reasons:
Items may have awkward wording, causing students to be confused when responding
Graphs, pictures, diagrams, or other information accompanying the items may be unclear or misleading
Items may have multiple correct responses
Distractors (incorrect options for multiple-choice items) may be obviously wrong, increasing the odds of guessing the correct answer
Items may represent a different content area than that measured by the rest of the test (multidimensionality)
Items might be written in ways that favor one group of students over another
P-values and point-biserial correlations (also called item-total correlations) offer numerical clues about whether the items on an assessment provide educationally useful information.1 This article focuses on helping educators interpret p-values and point-biserial correlations.
Interpreting P-Values
A p-value for an item that has only two score points (correct and incorrect) is the proportion of students who got an item correct.2 It is used as a reverse-coded indicator of item difficulty that ranges from 0.0 (no one answered correctly) to 1.0 (everyone answered correctly). When multiplied by 100, the p-value converts to a percentage, which is the percentage of students who got the item correct.
The interpretation of p-values depends upon the purpose of the assessment, so this makes it difficult to give hard and fast rules for what is a “good” or “bad” p-value. If the purpose of the assessment is to determine the level of prior knowledge, the p-values will be lower than if the purpose is to determine how well students understand material that has already been taught in class. In general, test scores are considered more reliable when the p-values are spread across the full range but concentrated toward the center, around 0.50.
Items with very high (0.90 or higher) or low (0.25 or lower) p-values should be given a qualitative review, even if you expect those results. An item that almost all students get correct (high p-value) may indicate that all students understand the material, but it could also mean the item was written in a way that clued students about the correct response. Or, it could simply be so easy that the score says very little about whether the content is fully understood. Similarly, an item that very few students get correct (low p-value) may mean the material is too difficult for their current level of understanding, but it could also reflect a poorly written item.
Interpreting Point-Biserial Correlations
The point-biserial correlation relates the scores students receive on a given item to the total scores that the students receive when summing their scores across all other items on the test. A high point-biserial correlation indicates that (a) students who got the item correct also scored high on the test overall, while (b) students who got the item incorrect scored low on the test overall. A low point-biserial correlation means that (a) students who did well overall got the item incorrect, and (b) students who did less well overall got the item correct.
A rule of thumb for reasonable point-biserial correlations is that they should be above 0.15, though our experience has shown that “good” items have point-biserial correlations of 0.25 or higher. A point-biserial correlation that is close to zero or negative often means that the key is incorrect, but other problems might also be present. For example, there may be multiple correct responses.
Items with low point-biserial correlations must be given a careful qualitative review because it is not logical that students who did well overall should get an item wrong that students who did not do well overall got correct. Something in the wording, presentation, or content may help explain the low correlation. Even if no obvious explanation for the low correlation is found, problematic items should be removed from scoring and future testing. Such items do not contribute consistent information about what students know.
Interpreting P-Values and Point-Biserial Correlations: Some Examples
Ideally, test items have both a p-value within the desired range and a relatively high point-biserial correlation. That is, each item has a reasonable level of difficulty (given the test purpose), and it discriminates between students who know the material well and those who do not. There is, however, no necessary relationship between the p-value and the point-biserial correlation. The point-biserial correlation should be used to assess item quality; the p-value should be used to assess item difficulty.
Our fictional classroom assessment provides examples of how to interpret item statistics. Assume this is a short summative assessment made up of multiple-choice and true/false items and administered at the end of a teaching unit to determine whether the students understand the content in that unit.3
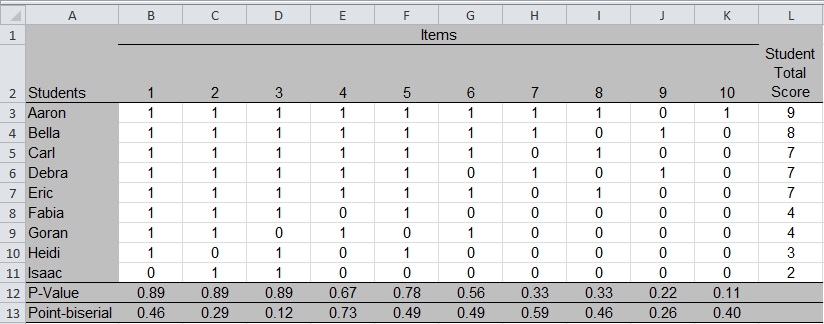
Figure 1 displays the student roster, item scores, p-values, and point-biserial correlations.4 The student names are listed in rows 3 through 11 of column A, and the item numbers are listed as the column headers (columns B through K) in row 2. All items are scored 0 if incorrect and 1 if correct. Each cell of the table contains the score that a student received on an item. For example, Isaac is the only student who got Item 1 wrong (score of 0 in cell B11).
Figure 1: Students, Item Scores, and Item Statistics
This is a highly stylized table with students conveniently listed in alphabetical order and in order of highest to lowest total scores, and with the items increasing in difficulty (p-values decline) from left to right in the table. The total scores would not seem “successful” from the point of view of the students, although they provide useful examples here. Classroom educators working with real data may wish to sort it by Student Total Score and rearrange items by p-value to see whether there are visible patterns in the item scores.
In our example data, Item 10 has the lowest p-value, 0.11; it is the most difficult item on the test. An examination of the item scores shows that only Aaron got it correct (score of 1 in cell K3). In column L, we see that Aaron had the highest score on the test, which is why the point-biserial correlation for Item 10 is above the problematic range (greater than 0.25). The item was very difficult for this set of students, but it differentiated well between the higher and lower performing students. The item statistics suggest that the teacher may wish to revisit the topic so other students gain a better understanding, but the item is not “bad” just because it has a low p-value.
The point-biserial correlation for Item 3 is low (0.12), even though it is one of the easiest items with a high p-value (0.89). Although most students found it easy, the point-biserial correlation indicates that something is problematic about this item. The item score matrix shows that Goran got Item 3 wrong, although he responded correctly to Items 4 and 6, both of which were more difficult as indicated by their lower p-values.
One explanation is that Goran guessed on Items 4 and 6, and he got lucky in guessing the correct responses. If, however, Goran did not guess and actually did answer Items 4 and 6 correctly, it suggests that Item 3 might measure something different from the rest of the test, at least for Goran. He was unable to answer an easier item (higher p-value), while getting more difficult items correct.
The example here is stylized, but in real life there may be a group of students like Goran for whom an item misbehaves. If we imagine a math word problem, the students for whom the item misbehaves may be English language learners. Or, we can imagine a vocabulary item that also measures background knowledge that some students might not have for whatever reason.
All items with low point-biserial correlations, regardless of their respective p-value, should be reviewed for content, wording, and potential bias. If an obvious problem can be corrected, the item may be revised and reused. If not, the item should be removed from future use as it provides confusing information with respect to what students know, even if many of them found it to be easy.
As a final example, note that Item 9 has both a relatively low p-value (0.22) and a relatively low point-biserial correlation (0.26). In the item score data, we see that only two students, Bella and Debra, got the item correct, and neither was at the top of the class in terms of total test score. An item with both a low point-biserial and a low p-value should be reviewed for content and wording. It may be that the content has not yet been covered in class or the response options are worded in a way that confuses students. Asking students about their responses would be helpful to the review process. The item statistics indicate some problem with the item that prevents it from contributing to meaningful test results.
Footnotes
1. We note that more sophisticated measures of item difficulty and discrimination can be computed using item-response theory models, but classical test theory tools give reasonable estimates and are accessible to educators who may have little training in psychometrics.
2. Computing an adjusted item mean (mean item score/maximum score possible) provides an estimate of item difficulty for constructed-response items, and the range is 0.0 to 1.0, but it does not convert to “percentage correct.”
3. Assessments are often classified as formative (assessment for learning, often ungraded) or summative (assessment of learning), but they may serve both purposes. See, Susan M. Brookhart, “Developing Measurement Theory for Classroom Assessment Purposes and Uses”
4. See Part 2 for how to compute p-values and point-biserial correlations. A report from a digital learning management system might show actual responses (A, B, C, or D; T/F) with the correct option in color or circled. Behind the scenes, the software will translate that to correct/incorrect scores based on the provided answer key.