
Susan McMillan, September 2020
At Educational Data Systems, we believe that geographic information systems (GIS) provide school district administrators with a key that unlocks efficiencies in using existing data.
If you are like many superintendents, your daily leadership tasks fall into roughly three categories: educational, political, and managerial1. Which tasks occupy most of your time likely depends on the size of your district and whether it is urban, suburban, or rural.
No matter your circumstances, effective leadership requires that you use data analysis to inform your decision making. Assessment, budget, facilities, labor contract data…the list goes on and on. Given the potential for data overload, adding geographic information to the mix may feel both overwhelming and irrelevant to your daily tasks.
However, geography is more than a physical location. It combines location with physical and/or cultural attributes (characteristics) associated with that location2. According to GIS-industry leader Esri, all aspects of a school or a district have a “geography”3. School buildings and bus shelters have a “fixed” geography. Students and buses have a “mobile” geography.
Geographic information systems (GIS) created specifically for school district planning use location as the key to merge data from various systems across the district.
Where’s the GIS Benefit for Educational Leadership teams?
Focus on Equity. With geographic data, leaders can analyze the location of educational programs in relation to where student needs are greatest. Your SIS data in a GIS—which functions as a relational database—will show not only who your students are, but where they are, and whether they all have access to high-quality educational programs and facilities, regardless of demographic sub-group.
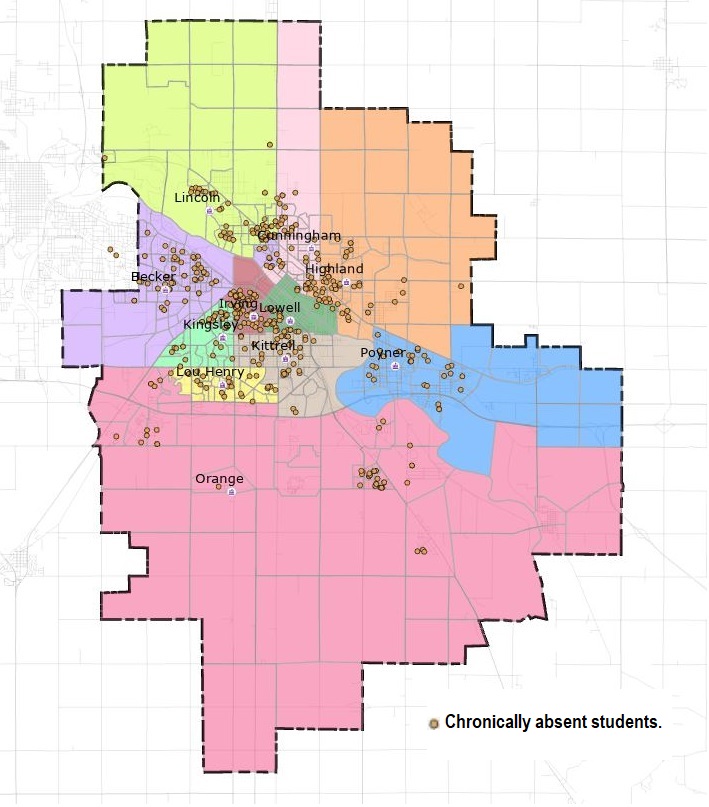
Improve Achievement. Understanding all the factors that contribute to student academic success is an ongoing and data-intensive project. Chronic absenteeism is one factor that is negatively associated with student academic achievement4. With geographic information tied to student-level attendance data in a GIS, you can map the data and see where those students live, as in Figure 1. The map can show where targeted interventions are likely to be most effective.
Communication. Day-to-day operations are more efficient with GIS tools. Schools districts with interactive school locator maps on their websites communicate which schools children will attend based on address, and can incorporate many other pieces of information relevant to the community.
GIS tools also add capacity for district leaders to use data to support change. Changing school boundaries, permanently closing a school building, opening a new school, and reconfiguring grade levels are politically challenging processes. The data needed for these difficult decisions can be overwhelming when presented in table after table. Further, discerning patterns from tabular data is challenging, even for experts who are familiar with the data.
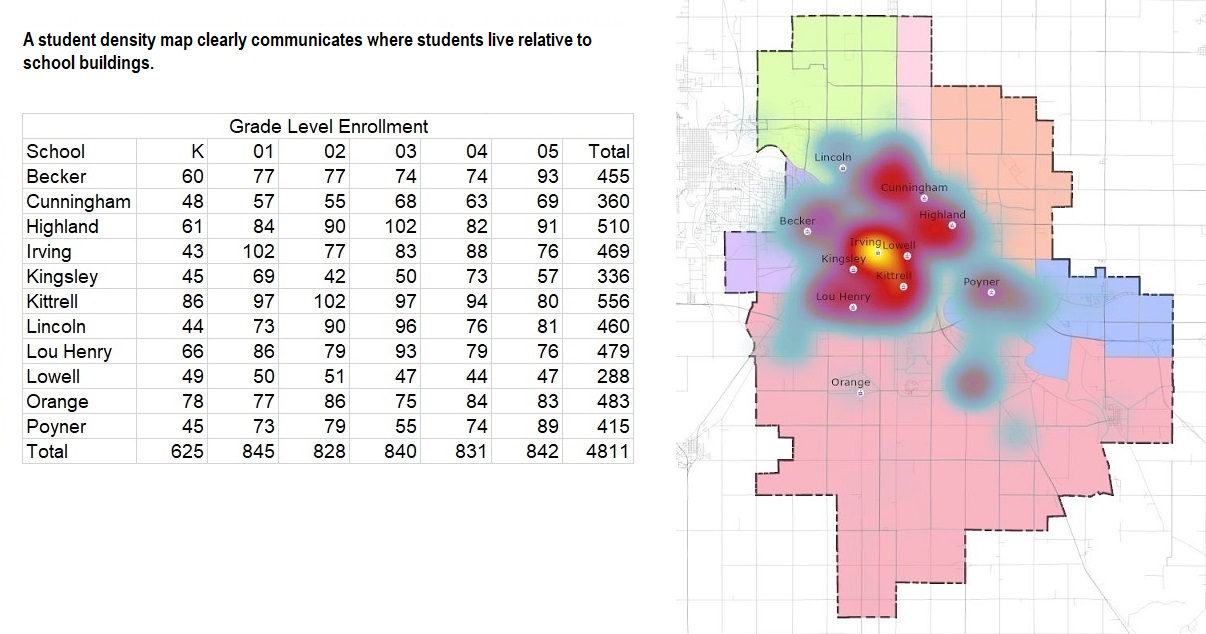
Easy-to-interpret maps are an effective way to mitigate the data overload problem and communicate patterns. The map in Figure 2 shows the geographic distribution of students relative to schools; information that is simply not available in the enrollment table.
When your data are in a GIS, you can use location information to demonstrate to your community why change is necessary and to model alternative scenarios. Districts that use GIS find that they can answer questions quickly and efficiently “in-house” rather than paying outside consultants.
Answer a whole new set of questions. Combining location data with other school district data in a GIS gives leaders the ability to answer questions that are not easy to answer without location information. Examples include:
- Where do we have buildings with spare capacity?
- Where are our buildings that are overcapacity?
- Where should we target funds for improvements?
- Do we need a new school? If so, where should it be located?
- Do we need to close a school? Which one?
- What is the best way to assign students to schools using my district’s criteria?
- What threats to safety are near our schools (e.g., railroad tracks, major roads, flood zones, earthquake fault lines, distance to fire station)?
- Where are the students most likely to need help recovering from a disaster or emergency?
If you are a school district administrator drowning in data, GIS tools provide an organizational principle that will help you use all of your data more efficiently.
Footnotes
1) contextual influences on superintendents’ time usage, https://epaa.asu.edu/ojs/article/view/390/513
2) https://www.nationalgeographic.org/activity/characteristics-of-place/
3) http://downloads2.esri.com/edcomm2007/syfr/pres/7-Syfr-ESRI-2009-Administration.pdf