By Rhonda Rollins, Writer/Editor, Educational Data Systems
This is Part 1 of a two-part series that explores the effects of neighborhood school closures. As nothing is ever black and white, neither is making the tough decision to close a school…nor the effects of that decision. Part 1 focuses on some of the emotional and physical effects. “Part 2: The Silver Lining,” to be published in May, will focus on what districts can do to mitigate the potential ill effects.
I remember many nights spent walking the short distance to my children’s schools for Halloween carnivals, Christmas programs, Back-to-School nights, etc.—where children ran and laughed on the playground while grownups chatted about gas prices or whatever else they could find “wrong” with the world. My children went to the three schools in our neighborhood—the elementary, middle, and high school—unlike their mom, who moved a lot as a child and always had to start over in different schools. I’m happy that they never had to master the art of continually making new friends, although I never really did master it. But moving a lot definitely gave me an appreciation for stability, routine, and community.
There are several reasons why school districts are faced with making the tough decision to close a school. Poor performance is a common reason; other reasons include low enrollment, outdated facilities, and funding shortages. But no matter how difficult the decision, the potential effects of closing a neighborhood school can be devastating. In Part 1, we uncover some of the aftermath.
Neighborhoods
One doesn’t need to listen to the We Live Here podcast or view the 2013 Chicago Public School Closings video that features a family desperately trying to save their school to understand the emotional turmoil surrounding the closure of schools in people’s neighborhoods. Just imagine your own children’s school shuttered (the term used for closed).
Chastity Pratt-Dawsey, who grew up in Detroit, talks about how the school and her community were so closely intertwined—
…the school was the community center, you went there after school for community meetings, of course your parents vote there. Especially the high schools, right? The high schools are the center of your neighborhood… And now people say, ‘Where’d you go to high school?’ And you’re talking about a school that no longer exists… So, it destabilizes the neighborhoods.
Detroit Public Schools shut down 195 schools in less than 15 years.1 That’s a lot of destabilization.
Studies have shown that when neighborhoods lose a school, it can hurt property values and tax revenues. Public schools are gathering places that may be sites for other social services such as parent education, job skills classes, health services or distribution points for donations. When students have to travel farther to school, even by half a mile, it can lower participation in enrichment programs and make it harder for parents to get involved.2
Along with the emotional effect of a school’s closing comes the visual wasteland in some cases. “Sadly, once the schools close, many of the buildings remain vacant, breeding crime and hemorrhaging resources.”3
A woman in this video talks about how the shuttered school in her neighborhood, Ada Lewis Middle School, which was closed in 2008 and remains vacant today, is a “magnet for negative activity and if someone is over here drinking and doing drugs, it can easily spread on down the street to the neighborhood.”4
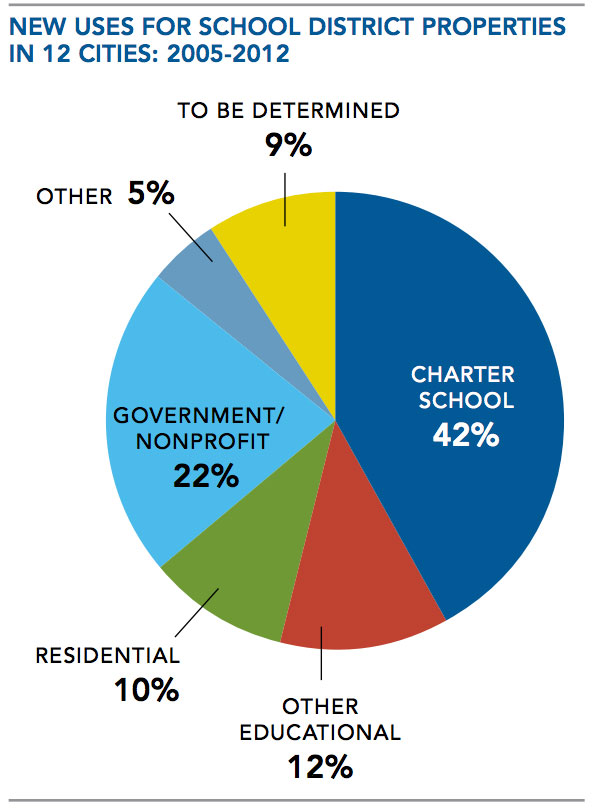
Because it can be difficult to sell or lease these empty buildings, many remain costly eyesores. The challenge of finding new uses for old buildings is daunting, and the downside of letting them sit idle can be significant. Since 2005, the 12 districts have sold, leased or reused a total of 267 properties and still have 301 unused sites on the market, empty buildings that can cast a pall over their neighborhoods and be costly to seal, maintain and insure.5
From Shuttered Public Schools: The Struggle to Bring Old Buildings New Life6
Many families also choose to move out of the neighborhood in search of better schools because they don’t like the “welcoming schools” their school district has chosen for their children. This further contributes to the deserted feel of the neighborhood once the school closes.
Student Achievement
Caroline Bauman says our assumption that students from low-performing shuttered schools will end up in better ones isn’t always the case. “Students who came from about half of the [21 Memphis schools the city closed in 2012] have been re-zoned to schools that either were academically on par or actually performing worse.”7
Avi Wolfman-Arent talks about a new study that was done during the time that Philadelphia closed more than 10 percent of its traditional public school buildings and displaced thousands of children between 2012 and 2013:
When students relocated to schools with good scores on the statewide English exam, their scores on that same exam went up. The problem, though, is that many students didn’t end up at these high-achieving schools. The worst results occurred when large numbers of displaced students arrived at a new school together. In scenarios where displaced students made up a quarter of all children enrolled at a receiving school, things went south. The displaced students performed poorly on standardized tests, and their new peers at the receiving schools also suffered academically. Steinberg believes that in these cases the district was merely replicating the conditions that had plagued the now-closed schools — a result that seemed to hurt all involved.8
Many resources agree that more support needs to be given to these welcoming schools to help them rebuild school culture.
As Grace Chen says in Why Public Schools Across the Country are Closing Their Campuses, “We are facing a new era in public education in this country, and the results of the changes, including school closures, will certainly be interesting to witness.”
Next month on “Part 2: The Silver Lining”— “It hurts to look at the clouds, but it also helps, like most things that cause pain.” ― Matthew Quick, The Silver Linings Playbook
Merriam-Webster defines a silver lining as “a consoling or hopeful prospect.” Unfortunately, the connotation is such that we cannot find the silver lining without first knowing the pain, heartache, sadness, despair, etc. from which we need to be consoled or to find some hope.… We must walk through it and figure out how finding that silver lining is going to happen.
By Rhonda Rollins, Writer/Editor, Educational Data Systems
This is Part 2 of a two-part series that explores the effects of neighborhood school closures. As nothing is ever black and white, neither is making the tough decision to close a school…nor the effects of that decision. “Part 1: The Aftermath,” published last month, focused on some of the emotional and physical effects. Part 2 focuses on what districts can do to mitigate the potential ill effects of school closures.
“It hurts to look at the clouds, but it also helps, like most things that cause pain.” ― Matthew Quick, The Silver Linings Playbook
Merriam-Webster defines a silver lining as “a consoling or hopeful prospect.” Unfortunately, the connotation is such that we cannot find the silver lining without first knowing the pain, heartache, sadness, despair, etc. from which we need to be consoled or to find some hope. As Shakespeare says, “ay, there’s the rub!”1 We must walk through it and figure out how finding that silver lining is going to happen.
As revealed in Part 1, closing a neighborhood school can be a very emotional and confusing time for parents and children, especially if they’ve gone to those schools for generations. So how can districts help to mitigate the possible ill effects of these school closures?
Build Trust: When a school district in New York decided to close one elementary school (George Washington) and send those students to another elementary school (Poestenkill), tensions rose from the parents in both schools. To try to make the transition as smooth as possible, the district formed “transition teams” in both schools:
We looked at the consolidation through the eyes of the students, of course, but we knew we couldn’t forget the parents; we needed to understand what they were feeling and reassure them. One George Washington parent who was involved in the school came to tears at every board meeting. She worried that she would not be able to be as involved at Poestenkill. To her, all those years of hard work would end when George Washington closed. But to me, she was a new parent with great ideas, and I wanted her to understand how much she would be welcomed.2
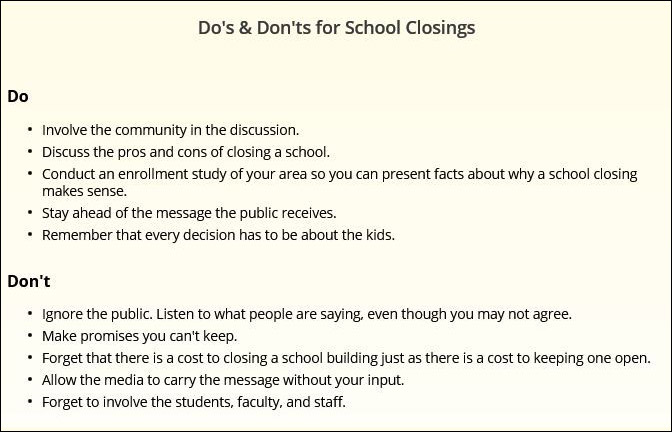
By doing this and much more through joint social and learning activities even before the change took place, the parents, staff, and students were able to build a new school community based on mutual respect and trust. The following is a list of “Do’s & Don’ts for School Closings” from one superintendent’s perspective.
From Surviving a School Closing
Use Spare Facilities to Expand Public Education: In this Hechinger Report, Mike Griffith, a school finance specialist at the Education Commission of the States, talks about how school enrollment could decline 8.5 percent a decade from now and that along with that comes less state funding, more school consolidations, and excess real estate.
One way of contending with declining enrollments, Griffith said, is to expand public education to younger children. Griffith predicts that many school districts will increase full-day kindergarten and start offering pre-kindergarten to all families. That way districts can recoup lost state funds and use their real estate. “It’s odd. But you might be able to provide pre-K and break even without any additional cost to the state,” he said. That would be a silver lining.3
A silver lining indeed! Full-day kindergarten and pre-K offered at the public school level would lessen parents’ need for paid childcare at preschools and other daycare centers.
But what about the benefits of pre-K for children at the public school level? According to Joshua Gowin, Ph.D., “The best time to provide someone with valuable life skills may be before kindergarten.”
One of the most important findings about brain development shows that the brain has critical periods for learning. If you deprive a brain of information during this crucial time, it may never develop properly; the opportunity is lost. On the other hand, some early experiences can forever enhance the development of a young brain, and potentially change behavior across an individual’s lifespan.4
And according to a fact sheet by PEW, “High quality pre-K can no longer be considered a luxury for upper income families or a special program for the disadvantaged. Based on what we now know about children’s brain development during these crucial years, pre-K has become just as necessary as kindergarten or first grade.”5 Therefore, policymakers, business leaders, and early childhood experts cite seven reasons for making this change in public schools, some of which include research (children who attended pre-K “were less likely to be held back a grade” and “more likely to graduate from high school”), preparation (“children unprepared for kindergarten tax the resources of the entire system”), Start Behind, Stay Behind (“children who enter school behind their peers often stay behind”), No Child Left Behind (“pre-K can help schools meet these requirements”), etc. “By funding pre-K for all children, states can increase standards, require research-based practices, and offer parents choices.”
Repurpose Vacant Schools: Two sisters in Detroit—who, together with others from the community, had already brought the neighborhood park back to life after “[it] had fallen on hard times,”—do more than talk about the possibility of their school closing and what that means:
…if that school becomes empty, we look at how we can turn it into a multi-use building. But we’re not going to have a building sitting in our community, decaying, because we’re developing our community. We have our park.6
Just as they had applied for grants and pitched to city and county officials for their park renovation, districts could help to repurpose vacant schools for these neighborhoods to prevent them from becoming part of the “aftermath.”
One such repurposing project that benefitted the community in multiple ways happened because of the Kansas City Public Schools Repurposing Initiative and Tulsa’s Project Schoolhouse. Shannon Jaax, the initiative’s director, acted on the premise that “officials must be sensitive to neighborhood concerns when deciding to shutter a school and what to do next.”
Over the next six months, she and her staff held neighborhood meetings to familiarize residents with their plans and gather input about what kind of uses they should target in potential sellers.
“We integrated community participation in every level of decision-making,” Jaax said. “We hope that will lead to ultimately better results for the long-term use at the sites.”
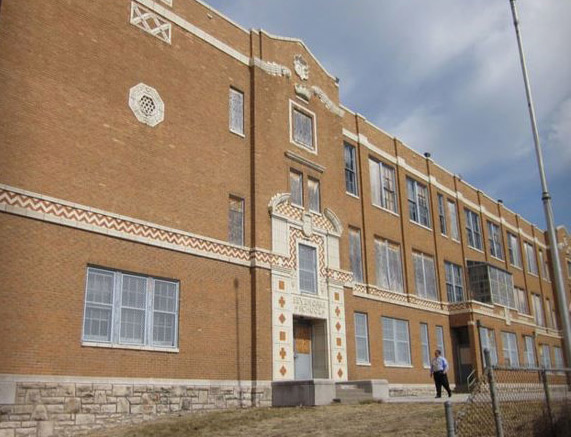
The school district then solicited proposals for three buildings that were deemed ready to be sold; all three have been sold as of May 2012. Two were purchased by charter schools, and the other will be renovated as affordable senior housing.7 (See the figure below.)
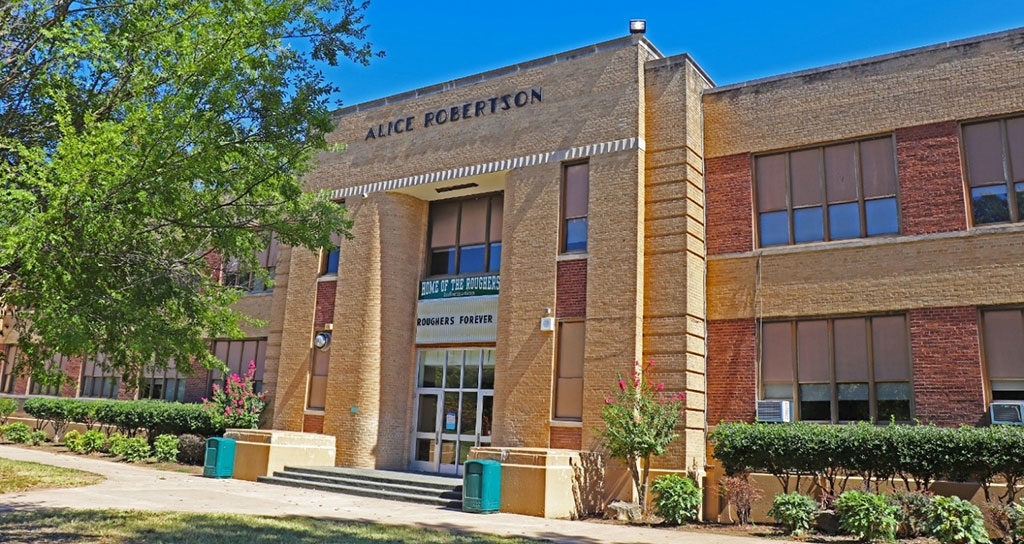
The exterior of Seven Oaks Elementary School in Kansas City, Mo. A deal is in the works to sell the school to a developer, who will refurbish it as affordable senior housing. Photo: Kansas City Public Schools (From Repurposing Schools Gives Life to Vacant Buildings)
One cannot help but be struck by the symbiotic nature of this silver lining—one facility having housed young minds in an academic setting then becoming the shelter for seniors who have come full circle. Both are very much needed in the community; therefore, there is no structural wasteland.
In a slightly different way (i.e., swapping properties), an Oklahoma City school district works with the city to ensure that neighborhoods are not “blighted” by vacant buildings:
With another two long-vacant schools, Creston Hills and Marcus Garvey, the school board swapped the properties with land owned by Urban Renewal that will provide the school district with a field next to Northeast Academy as well as land for a new south Oklahoma City school.
“We’re trying to be smarter in leveraging our partnerships to get what we need for our students while making sure we’re not leaving blighted vacant buildings in communities already struggling with these kinds of issues,” Kaye said.8
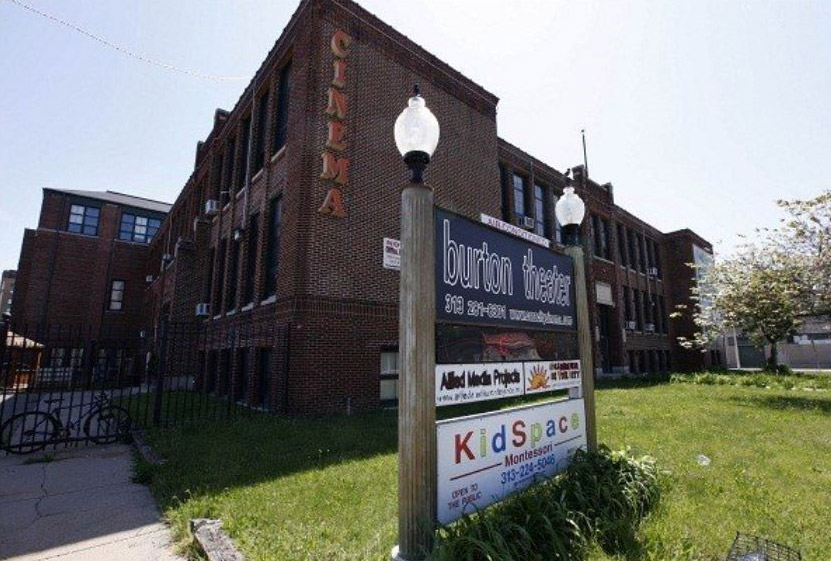
And in Detroit, the auditorium and gymnasium of the 100-year-old Burton International School was transformed into a movie theater by Developer Joel Landy when he remade the school into the Cass City Cinema. This time, the silver lining is their new silver screen. (See the figure below.)
Burton was among dozens of Detroit public schools forced to close in recent years as the district sank into debt and parents sought better education options. Now the city is getting high marks for its efforts to reuse those buildings—as churches, substances-abuse centers, housing and more. The practice also offers lessons to other districts confronting the same challenges.9
Paul Sancya / The Associated Press (From Repurposed Schools Offer Lessons in ‘Ultimate Form of Recycling’)
With consideration and respect for the communities of shuttered schools, school districts can add to the creativity of building new experiences for the neighborhoods and the people in them.
Provide Access to Better Academic Programs and Extracurricular Activities: “Between 2002 and 2008, the New York City Department of Education closed twenty-nine low-performing high schools and opened more than 200 new small schools as part of a series of major school reforms. At the time, the controversial move sparked community protests and even lawsuits.”10 But what a series of studies from a social policy research firm, MDRC, found was that these smaller schools graduated more students than other NYC high schools; and another study from Research Alliance for New York City Schools found that middle schoolers also benefitted from these school closures because they would have enrolled in the low-performing high schools now shuttered. One mother is happy that her children will be able to choose a different high school more suited to their varied talents and strengths.
When consolidating school districts, and especially when school closures are a part of that plan, it can be especially difficult for rural communities, yet some have found their own silver linings.
Consolidation of schools has both curricular and financial advantages. First, it often enables the consolidated schools to share courses and facilities. Sharing results in a more varied curriculum because fewer classes are dropped due to low enrollment. Expenditures for capital improvements and basic maintenance are reduced because there is no need to upgrade or maintain duplicate facilities… Consolidation of schools also can produce psychological benefits. When combined, schools often gain a confidence and an identity in the community they did not previously possess (Kay 1982). Sports programs and extracurricular activities flourish in consolidated schools because of combined funding.11
And in Arkansas, when the school district closed Hughes elementary and secondary schools to consolidate with West Memphis:
Gary Masner, the school board president in West Memphis, said the district went above and beyond to try to accommodate Hughes students. He said students have access to more Advanced Placement courses than they did at Hughes, dual-enrollment courses, and a world-class choir program with Opera Memphis. “It was the best thing that ever happened to those kids,” Masner said. “Maybe the parents didn’t particularly like it. Now they are here, and they are seeing the increased exposure they have to better facilities and better selection of courses and more extracurricular activities. The kids have thrived.”12
Sometimes the silver lining can take a long while to find. And some, unfortunately, may not be able to see it at all. But school districts and city officials can certainly work to keep the lines of communication open in the wake of hard decisions that potentially affect way more than the bottom line. And at the end of the day, members of a school district and a neighborhood community that walked through the aftermath of a shuttered school just may be sharing a bag of popcorn at the refurbished Cass City Cinema.
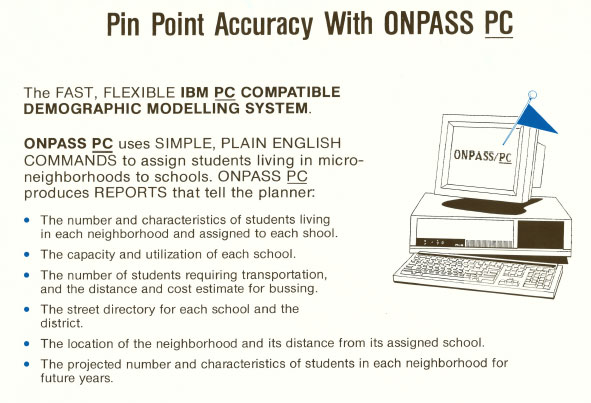
Software that gives school district administrators the tools to combine student data with geographic information provides much more than a nicely drawn and colorful map of the district. School district administrators can face multiple challenges more confidently when they analyze their data in a platform based on a geographic information system (GIS). Two recent articles highlight how ONPASS® Pro, a GIS tool for school districts, helps solve multiple types of problems.
Administrators at Muskogee Public Schools faced difficult decisions related to declining birth rates and increasing numbers of families choosing nontraditional school options. In an article for eSchool News, Chief Information Officer Eric Wells describes how the district used ONPASS Pro to create multiple planning scenarios so they could reach a satisfactory solution.
District administrators worked with members of the community to devise a plan that turned an elementary school into a 6th grade center, closed a middle school, and moved those students to a larger elementary school. These changes required rezoning 2,700 students served by the remaining five elementary schools. Mapping the data helped show community members where students lived relative to school programs, demonstrated the need to move the location of one program, and even suggested unexpected efficiencies in the transportation department. Being able to show all stakeholders the data behind the decisions helped to calm an emotional situation.
Members of the Community Consolidated School District #15 (IL) have been very active in an ongoing redistricting process and have found data analysis to be a central part of their efforts. The district had not redrawn school attendance boundaries for at least 25 years, and newly elected School Board members wanted to align boundaries with where students currently live.
Superintendent Scott Thompson wrote in “Redrawing School Boundaries with Confidence” that “Any open, transparent, and inclusive process…has to begin with accurate data presented in a way that makes sense to the stakeholders.” The district used ONPASS Pro to map the school attendance boundaries and run many boundary scenarios so everyone involved could see how changes affected multiple schools in the district. Thompson pointed out that the scenarios provided “instant feedback” that allowed for immediate adjustments. The data analysis has provided confidence that the best possible boundary-change plans will be adopted.
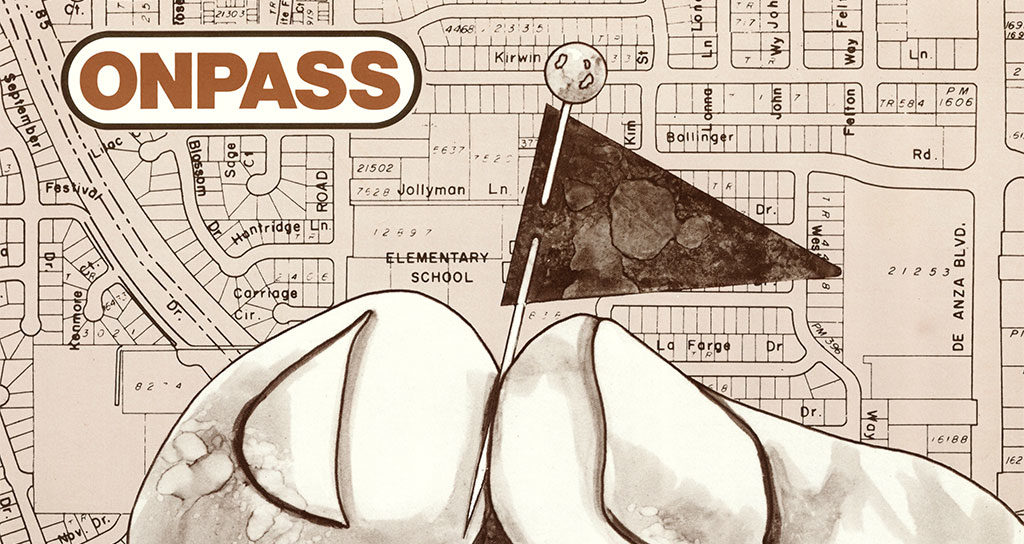
Since the establishment of the one-room schoolhouse, school districts across the country have faced ever-changing shifts in student populations. As one room turned into two and two turned into three, schools have had to adapt, open, close, and sometimes reopen. That’s where ONPASS, our flagship software product, got its start—as a tool to help school districts anticipate and plan for changes based on student enrollments.
The Beginning
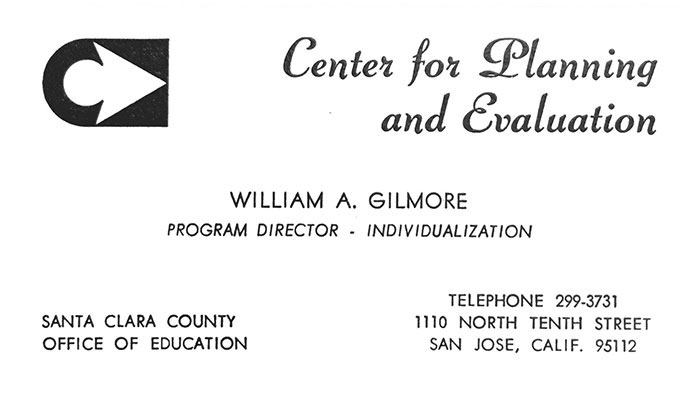
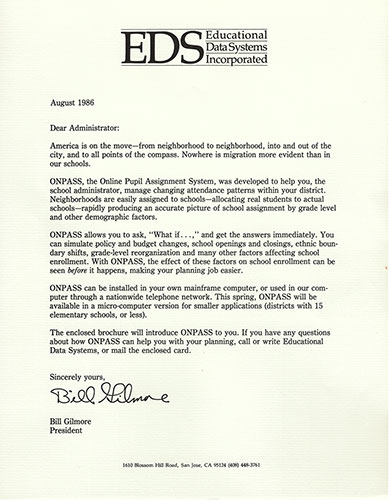
The story of ONPASS goes back a ways. In 1970, William (Bill) Gilmore, my father—a science teacher for the East Side Union High and Oak Grove School Districts in San Jose, California—left teaching after 15 years and began his work in school district planning and evaluation. He became the program director of Individualization at the Center for Planning and Evaluation (CPE) for the Santa Clara County Office of Education (SCCOE). It was “[a] center devoted to the improvement of educational practices through systematic planning and evaluation.” At that time, he also began to continue his own education at Stanford University in the fields of statistics and computer programming.
At the CPE, my dad worked in the area of individualized learning, continuing an initiative he led when he was teaching. At Andrew Hill, he ran Project 360,[1] an experimental program that included planning for the learning environment and individual learning needs of the student. This led to his interest in school district facilities planning. (As an aside, apparently, I went with my dad on field trips during this time. I’m the little girl standing at his feet in the picture on page two of the Project 360 newsletter dated February 1967.)[2]
Eventually these disciplines—measurement and evaluation, planning, and computer programming—would converge and become the basis for his future company.
Early Geographic Information Systems (GIS) and School Planning
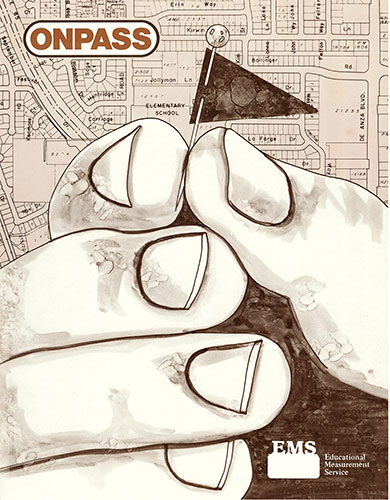
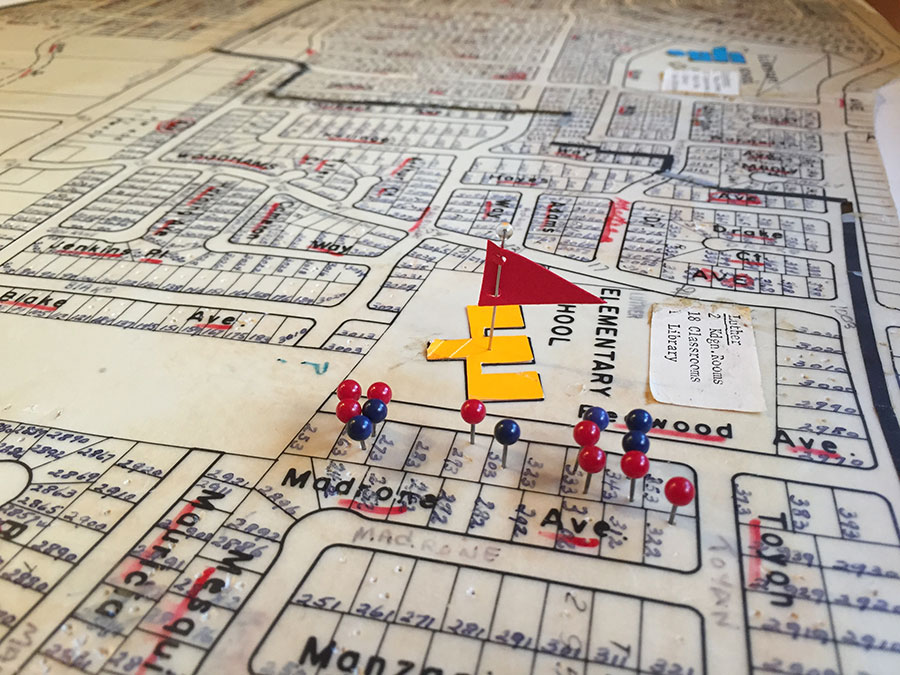
The old way (maybe not the oldest way, but the pre-computer way) to manage change in a school district was to use a big map on the wall that had thick black lines around the district’s boundaries, flag pins at the location of each school site, and beaded pins to mark the location of each student living within the district.
I remember walking past one of these maps in the hallway of the Cupertino Union School District (CUSD) as a teenager circa 1972 when I spent several Saturdays helping my dad work with the district’s planners.
To digress a moment, I’ll provide a bit of context for the planning being done at the CUSD during that time.
In the 1960s, Cupertino, located in the heart of the San Francisco Bay Area (later known as Silicon Valley), had been growing rapidly. A primarily agricultural area had turned into suburban housing tracts that brought in thousands of families and school children. From the 1960s to the 1980s, the SF Bay Area saw the equivalent of a Gold Rush—more like a Silicon Rush—with computer hardware, software, and semiconductor companies moving in and starting up all over the Bay Area. Ten miles to the west of the district was Intel (in Santa Clara). Fifteen miles to the north was Hewlett-Packard (in Palo Alto). About 15 miles south was the IBM Research Laboratory (in San Jose), and just down the street from the CUSD was a small but growing company called Apple Computer (on Stevens Creek Blvd. in Cupertino). There was also DEC SRC, Amdahl, Rolm Corporation, Sun Microsystems, Xerox PARC, Oracle, Tandem Computers, Atari,AMD, National Semiconductor, Applied Materials, Fairchild Semiconductor, and Seagate Technology (to name just a few of the larger companies)—all with offices in the SF Bay Area.[3]
Needless to say, the population in the area was growing and changing daily. Schools could hardly be built fast enough.
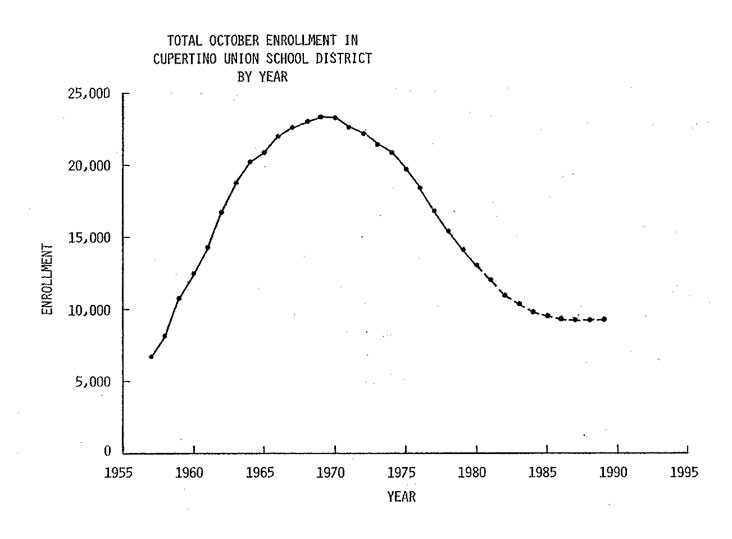
Early in the 1960s, the [Cupertino Union School District] grew at a rate which would make it at one time the fastest growing elementary district in the nation and the largest in the state. During the peak growth years, the district was building five schools per year in an attempt to keep pace with an enrollment increasing by as much as 20 percent in a single year. By 1969–70, the district had built a total of 42 schools for its 23,300 students and the era of expansion had ended.[4]
In 1960, the district had approximately 12,800 students. By 1970, student enrollment peaked at approximately 23,300; but as the decade went on, the land was built out, families settled in, and their children grew up, found jobs, went to college, or moved away. Just like with any rush, things slowed down. By 1980, the enrollment was back down to just over 14,000. (The 2017–18 student enrollment was 18,017.)
Different versions of this same story have played out thousands of times over the decades at school districts across the nation. Most of us—whether as children attending school or as parents, grandparents, or community members—have experienced the opening or closing of a neighborhood school due to growth or decline of the student population.
Back to where ONPASS got its start…
My father worked with the CUSD as a consultant on assignment from the CPE during that period of high growth and then decline. He was charged with assisting the district with its facilities planning, which included using its big wall map to help manage the rapidly changing student population. On a daily basis, “student” pins were added, moved, and removed. When a new school was built, the map was redone: thousands of pins taken off, school attendance boundaries redrawn, and thousands of pins placed back onto the parcels of the revised map. The district greatly needed a better and more efficient way of managing its planning process.
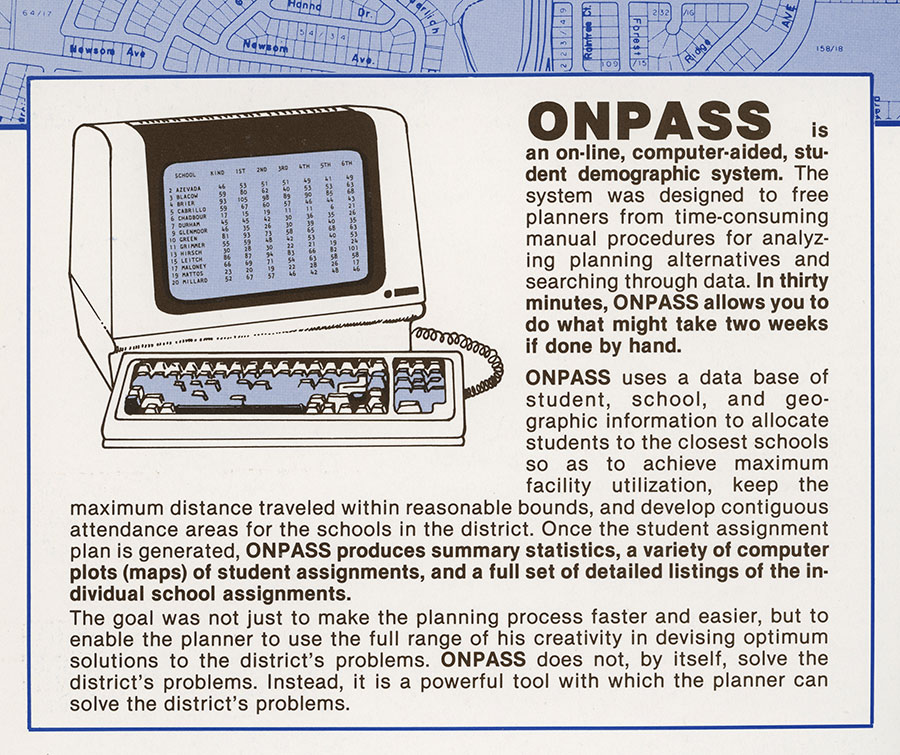
In the early 1970s, a new computerized planning method was being used by some school districts in southern California. It was a software program that computerized the geographic elements of the district (e.g., the school buildings, streets, and boundaries) and stored the student information in an “online data base.” (Note that “online” in pre-Internet days simply meant computer based.) The early GIS computer program, originally developed by Urban Decision Systems[5] in Los Angeles, was called ONPASS, short for Online Pupil Assignment System.[6]
As the story goes, the original algorithm used in the ONPASS program was developed in the mid-1960s by Peter S. Loubal and a small group of research engineers at System Development Corporation (SDC) in Santa Monica, California. They were researching minimum paths and traffic efficiencies for the transportation industry. In an email exchange with my father in 2015, Loubal, explained:
In 1965 or 1966, while working for the (SF) Bay Area Transportation Study (BATS), in charge of traffic forecasting, I met Vlad Almendinger and Bob Totscheck of SDC, in connection with their effort to develop a comprehensive demographic, travel and traffic data management capability to support the multitude of planning efforts in our (and any other) study area. The technical director at BATS was Jay McBride, and we four spent many hours discussing the capabilities needed to manage and fully utilize the vast amounts of data that would support the various modeling efforts.[7]
In his paper, “A Procedure for Allocating Resources Over a Network,”[8] Loubal wrote: “[The procedure] is particularly suited for evaluating possible new locations for schools…and which existing locations should be expanded. A very fruitful area for applying the model is advance emergency planning and operational control in emergency situations. Such applications include the allocation of people to hospitals or to fallout shelters, and the development of contingency evacuation plans.” In his email with my father, Loubal recalled many applications that “deal[t] with transit rather than highway connections…fire spread in structures and terrain…military convoy movement… building a power-line system…evacuation applications (saving as many lives as possible, with limited transportation resources), locating fire-stations, etc., etc., every application was a new challenge.”
In 1970, several people from SDC left to start Urban Decision Systems of Los Angeles where they continued to work on these applications. They commercialized the method for education planning in a program called ISPP (Interactive School Planning Procedure) later called ONPASS, Online Pupil Assignment System. The program ONPASS was first used in the Santa Monica Unified School District in 1971. Kenneth E. Needham, then vice president of UDS, sold a consultant services agreement to the Cupertino Union School District[9] in 1974, where my father was first introduced to the system and computerization of the education planning process. By 1975, it was also being used by the Newport-Mesa Unified School District and the Grossmont Union High School District.
From 1975 through 1980, after decades of rapid growth, the CUSD began to experience declining enrollment. Working with several district planners, my dad used ONPASS to assist the CUSD in planning for and executing the closure of five schools in 1975, six schools in 1978 (including converting two of these schools to different purposes), two schools in 1979, and two schools in 1980—a net closure of 13 schools in five years.[10]
Starting His Business
Having left the CPE when its grant funding ran out and the unit subsequently closed, my father continued working with the CUSD and other school districts as an independent consultant in the areas of planning and evaluation. For computing, he installed a landline to Stanford University’s mainframe computer connected to his “DECwriter[11]” terminal in the den of our house. (For those unfamiliar, a DECwriter was a desk-like apparatus that had a keyboard, a dot-matrix printer, and fanfold paper coming out of the top. No CPU or monitor.) He had a computer timesharing account at Stanford (#W1.C69) and a mail cubby for output (bin 943) at the university’s computer center.
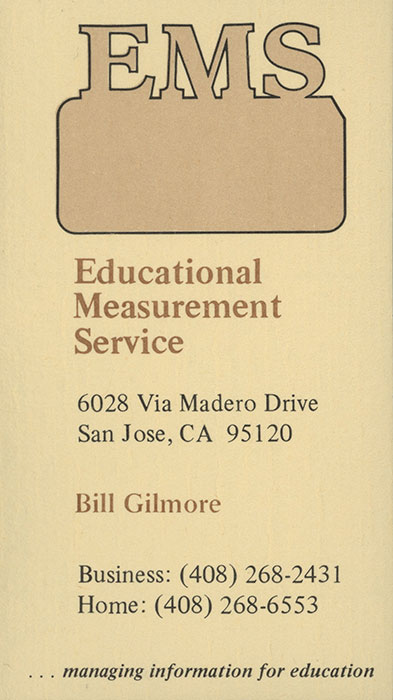
In 1974, my father started his sole proprietorship called Educational Measurement Service. He hired a bookkeeper and a computer programmer and opened a small office near our house.
In 1981, I was fresh out of college and needed a job, so my dad hired me; I was employee number four. By that time, we had several “dumb” terminals (with actual monitors) connected to the mainframe computer at Stanford. My unofficial title was “gopher” because one of my first jobs was to drive from the office in San Jose to Stanford University to pick up computer printouts—a 45-minute drive (one way) to pick up reports (and many times to deliver another check to pay for timesharing)! I did that run several times a week, sometimes multiple times in a day.
In 1982, to commercialize its use for his newly formed corporation, Educational Data Systems, Inc., my dad purchased the ONPASS software source code and obtained full and exclusive rights from Urban Decision Systems. By January 1987, he had developed ONPASS to run on our own microcomputer, an IBM model 360 mini-mainframe that actually sat in a “computer room” in our office. (No more driving to Stanford!)
My father programmed modern (at that time) GIS functions into ONPASS by using the Census Bureau’s GBF/DIME (Geographic Base File/Dual Independent Map Encoding) files, which used street segments and nodes to build a computerized network of streets across an area. To geocode the students, ONPASS used a database of streets, addresses, and nodes to match to the students’ addresses and then present them on a map on the computer. The database linked student addresses to their assigned schools, and a simulation could then be run by the user to model changes such as the closing or opening of a school and reassignments of students. Over time, the Census Bureau replaced the GBF/DIME files with the TIGER (Topologically Integrated Geographic Encoding and Referencing) database containing digitized maps and streets. He purchased these files and loaded them to ONPASS for the area surrounding each school district client.
By 1990, he had reprogrammed ONPASS to run on DOS-based PC computers; then, after Microsoft released its Windows platform, he and a small team of programmers converted ONPASS to run on Microsoft Windows, updating the code over time with each of the various Windows versions released. Suffice it to say, ONPASS has been under continual development from the 1960s to today!
For 40 years, from 1974 through 2013, my dad sold, installed, and supported the software in hundreds of school districts across the nation—from Beaverton School District in Oregon (his first ONPASS client) to Tucson, AZ to Fairfax, VA and the Bureau of Indian Affairs (to name a few).
In late 2018, we announced our most recent version of the ONPASS software, rewritten this time from the ground up to run on Esri’s latest GIS platform, ArcGIS Pro. It is now a 64-bit program that contains all the power of ArcGIS Pro, utilizing a geodatabase and varied base maps (aerial, streets, topographical, etc.) and easily integrating external data sources via shapefile formats such as County Assessor’s and Census Bureau geospatial data. Multiple layers of data can be presented at once and turned on and off to show boundaries, school buildings, and students as icons instead of pins on the map. The new program still has the foundational functions as the original ONPASS but uses today’s GIS technology to model changes in student populations and simulate the optimal assignment of students to schools. Thinking back on those days of programming each tool and report with hundreds of lines of code, it is amazing what the early GIS programs were capable of doing.
The End of the Story, But Not the End
In my earlier blog post announcing the upcoming release of our newly developed ONPASS program, I promised to tell the (long) story of our software, and so I have told it—as much as I know and can remember. I mentioned that, although we have now completely rewritten it, we have lovingly retained the name ONPASS. Why lovingly?
Lovingly because time brings value and, as you now know, ONPASS has been around in one form or another for more than 50 years!
Lovingly because ONPASS has served a real and important purpose in education, helping hundreds of planners, superintendents, and educators make better decisions on behalf of their students and families.
Lovingly because ONPASS was my dad’s life’s work. He rolled up his sleeves and not only designed the features and functions of the different versions, he programmed them himself. He kept apprised of the latest technology and made sure ONPASS was always at the forefront. He also marketed, sold, and demonstrated the software as well as traveled to meet his customers all over the country. He listened to their feedback and internalized their stories and needs. He developed personal relationships, even friendships, with many of them. He used ONPASS to help them in their jobs.
Lovingly because my dad warned me in 2015, the year after he retired (at the age of 83), that it would be a two- to three-year endeavor to rewrite ONPASS, and he was right (well, not really, it’s taken four years); lovingly because I am certain the new ONPASS would make him proud.
Lovingly because I now carry on doing what my dad loved to do: work with educators to solve problems, to make their jobs easier, and, ultimately, to help more students succeed.
My dad, Bill, passed away on July 6, 2017 at the age of 85. His entire career, even into retirement, was spent in education. So, also, lovingly because ONPASS has become a symbol of my dad’s career and of my own career as I worked for, and then alongside, and now in memory of, my dad.
I am very happy to share this story—one that my father loved to tell—and to be releasing ONPASS Pro, maintaining our company’s long tradition of planning for change and serving education.
As of April 2022, we sold the ONPASS Pro software to Angie Templeton of Templeton Analytics, a new company focused on selling the software and offering school district planning and GIS services. Angie has a long history of serving school districts in the areas of demographic and enrollment forecast planning. In the late 1990s and early 2000s, for her previous company, she worked with my father as a partner selling ONPASS to clients. She also was a former ONPASS trainer helping school districts learn the ins and outs of using the software to plan for district changes.
I am very pleased and am sure my father would have been happy that ONPASS Pro will live on with Angie’s new company. What’s most gratifying to me is that Angie understands and appreciates the value of the software as a powerful tool for school district planning and that she will continue to build upon my father’s legacy.
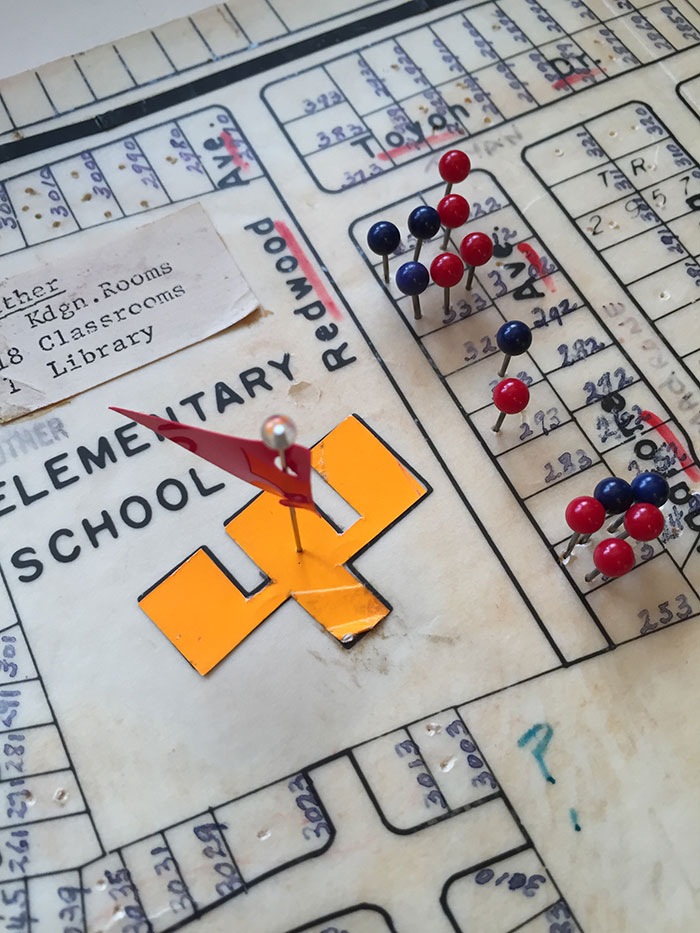
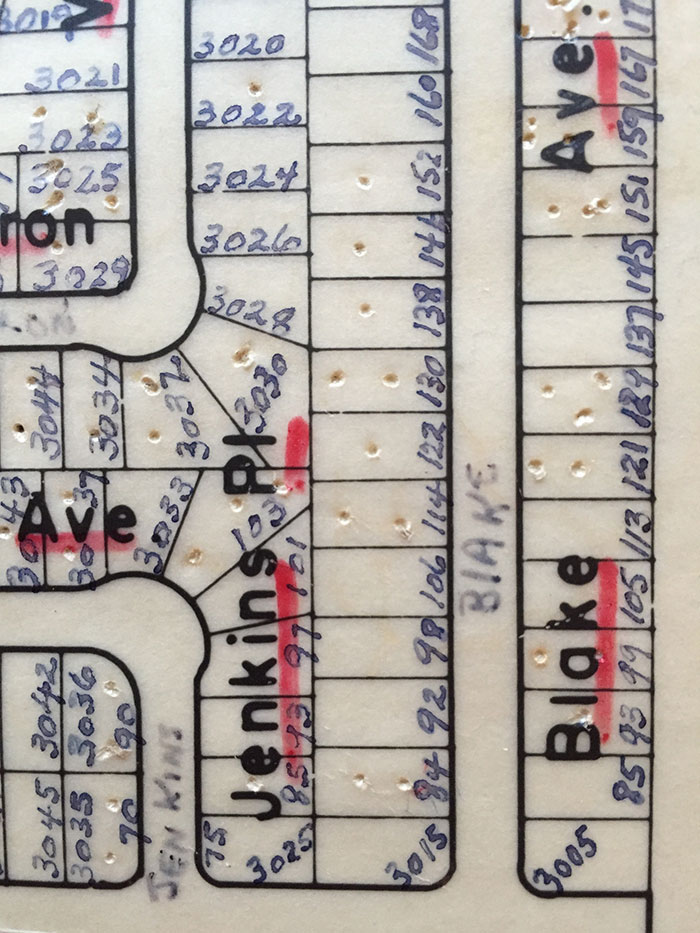
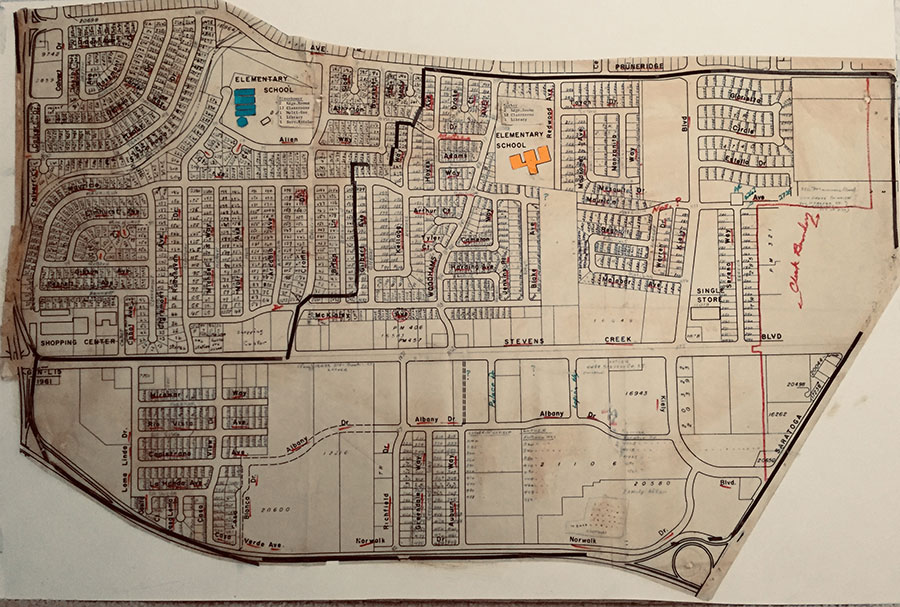
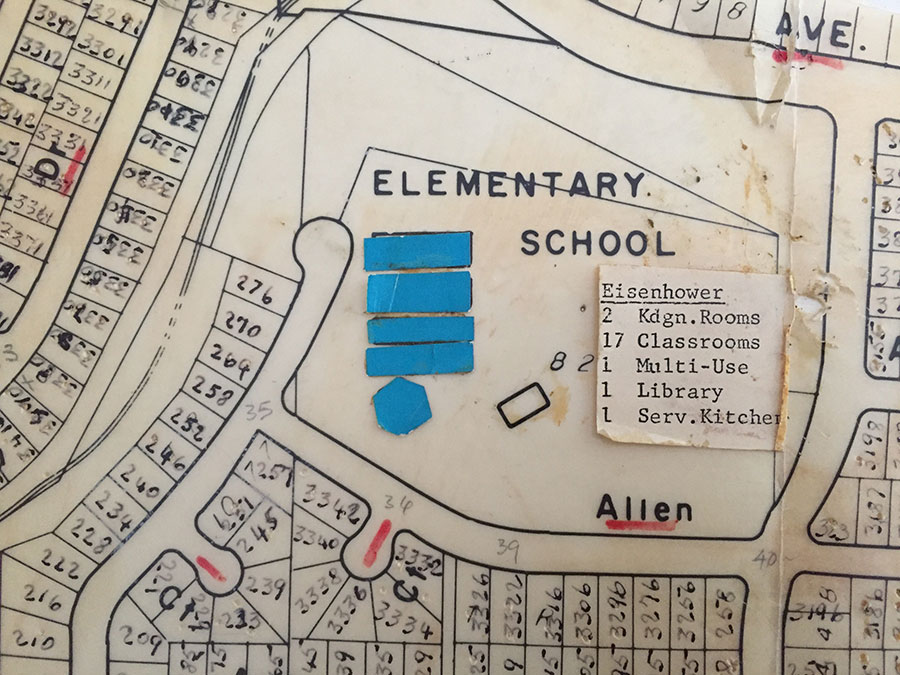
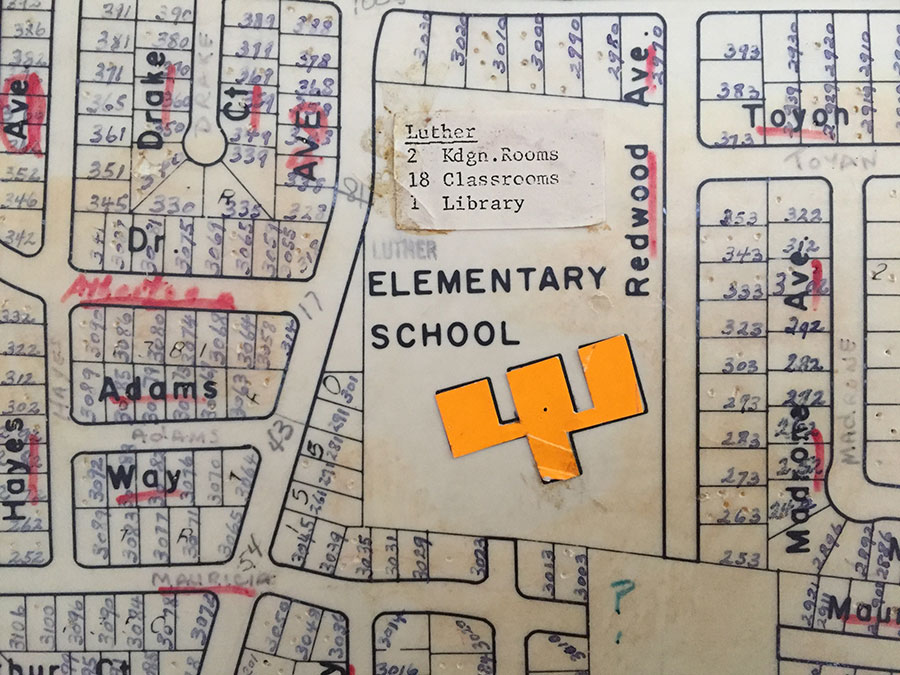
The images of the map you see are from the actual CUSD wall map that was used for planning before the district began using the ONPASS software program. My dad must have acquired this piece before it was put in the trash bin. This segment shows just two elementary school attendance areas. I placed red and blue pins into preexisting holes on a few parcels for effect.
Segment of CUSD wall map (approximately 1/25th the size of the whole district map)
Note the sophisticated facilitates inventory system
Note the sophisticated facilitates inventory system
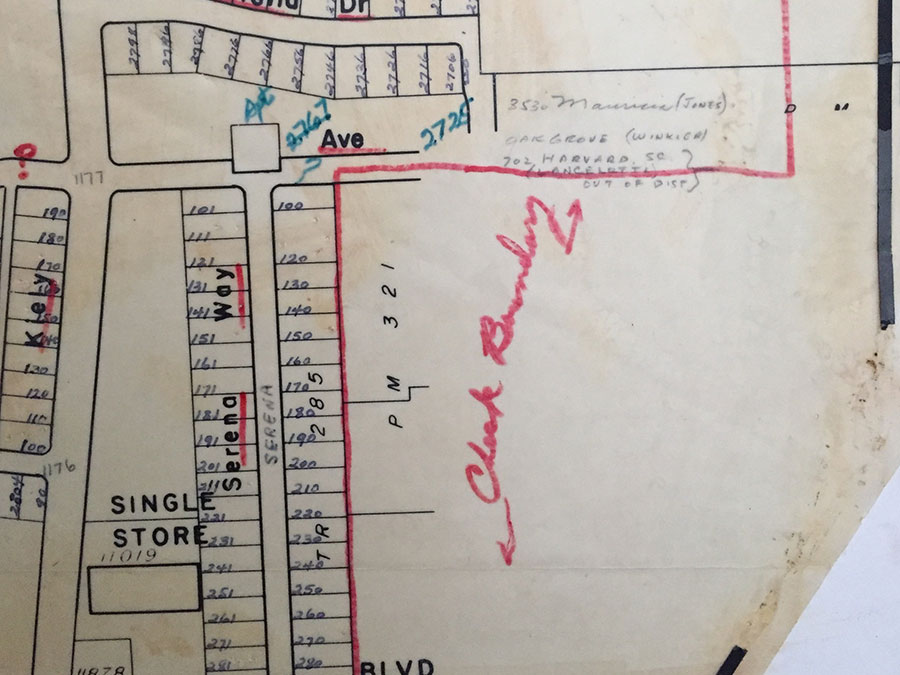
Notice the hand-drawn boundary with note ‘Check Boundary’
Note the thick black boundary tape going down the back fences of homes
The number of pins required to track students in just a small area of the district was incredible
FOOTNOTES: [1] William A. Gilmore, Report Project 360, 1966–1968, Andrew P. Hill High School, East Side Union High School District, pp. i–ii, 1–6 [2]Project 360 Report, Andrew Hill High School, Vol. 1, No. 1, (February 10, 1967) [3] See the Computer History Museum [4]Cupertino Union School District Long Range Facilities Master Plan, (April 22, 1980): I-1 [5]ONLINE, A Publication of Urban Decision Systems, Inc., Issue No. 5, (Fall 1977): 4–5 [6]Computer Assisted School Facility Planning with ONPASS, Urban Decision Systems, Inc., Los Angeles, CA, Oct. 10, 1975 [7] Peter S. Loubal, Email to Bill Gilmore, August 30, 2015 [8] Loubal, Peter S., “A Procedure for Allocating Resources Over a Network,” May 1969, System Development Corporation, 7 [9]ONLINE, a Quarterly Publication of Urban Decision Systems, Inc., Vol. 1, No. 3, (Spring/Summer 1975): 2,5 [10]Cupertino Union School District Long Range Facilities Master Plan, (April 22, 1980): III-7 [11] See DECwriter
The end of the calendar year provides an opportunity to reflect on resources that we’ve found useful, intriguing, or beautiful. This blog provides a list—in no particular order—of five websites related to school district planning or geographic information systems (GIS) that caught our interest in 2018. We hope you will find these links helpful, and Happy New Year!
School District Planning. Facilities management at school districts has long been a place-based process. Advances in GIS tools present opportunities for districts to blend geographic data with other sources of information. Broward County, FL has been a leader in using GIS for data analysis and presentation. Their website offers excellent explanations for how GIS is useful to the school district in general and district planning in particular.
Desegregation. Desegregating public schools continues to be a hot-button issue in the US. This heavily researched article by Alvin Chang discusses how school attendance boundaries contribute to, or mitigate, segregation based on neighborhood patterns. The interactive maps and charts provide eye-opening visuals, and the article includes plenty of links to the supporting research.
Cartography. In “Storytelling with Maps on Paper and Screen,” cartographer Allen Carroll discusses the differences between maps for printing and maps for display on screens. Beautiful maps accompany the text to illustrate his conclusion: …print provides the luxury of space—of presenting lots of fine detail across the expanse of a sheet of paper—while digital gives us the advantage of time, enabling us to unfold a narrative along the razor-thin membrane between past and future.
Enrollment Projections. School district administrators in multiple departments must rely on enrollment projections in order to make effective plans for the future. Districts also need to keep an eye on nation-wide demographic trends. The National Center for Education Statistics provided a 2018 update with projections by region and state.
Citizen Science Projects Using Maps. As school districts continue to implement the Next Generation Science Standards (NGSS), educators may find citizen science projects engaging and useful for students. This article by Diana S. Sinton for Directions magazine provides many links to citizen science projects that involve mapping applications.