By Susan M. McMillan, PhD
Our 2003 paper on point-biserial correlations and p-values, item statistics from classical test theory, has been one of our most popular publications. This three-part blog provides a slightly revised and refreshed explanation for how item statistics can be used by educators to improve classroom assessments. Part 1 is a nontechnical overview of item analysis and explains why we recommend it for classroom assessments. Part 2 describes how to compute p-values and point-biserial correlations using an Excel spreadsheet, and Part 3 discusses the interpretation of item statistics.
Part 3: Interpreting Item Statistics
When educators give quizzes or tests, they need to determine whether the scores accurately reflect student knowledge or whether the scores reflect problems with the assessment items. The objective of reviewing item statistics is to identify problematic items, also called “bad,” “misfitting,” or “misbehaving” items so they can be revised or removed from scores and from further classroom use.
Items may be problematic for one or more of the following reasons:
- Items may have awkward wording, causing students to be confused when responding
- Graphs, pictures, diagrams, or other information accompanying the items may be unclear or misleading
- Items may have multiple correct responses
- Distractors (incorrect options for multiple-choice items) may be obviously wrong, increasing the odds of guessing the correct answer
- Items may represent a different content area than that measured by the rest of the test (multidimensionality)
- Items might be written in ways that favor one group of students over another
P-values and point-biserial correlations (also called item-total correlations) offer numerical clues about whether the items on an assessment provide educationally useful information.1 This article focuses on helping educators interpret p-values and point-biserial correlations.
Interpreting P-Values
A p-value for an item that has only two score points (correct and incorrect) is the proportion of students who got an item correct.2 It is used as a reverse-coded indicator of item difficulty that ranges from 0.0 (no one answered correctly) to 1.0 (everyone answered correctly). When multiplied by 100, the p-value converts to a percentage, which is the percentage of students who got the item correct.
The interpretation of p-values depends upon the purpose of the assessment, so this makes it difficult to give hard and fast rules for what is a “good” or “bad” p-value. If the purpose of the assessment is to determine the level of prior knowledge, the p-values will be lower than if the purpose is to determine how well students understand material that has already been taught in class. In general, test scores are considered more reliable when the p-values are spread across the full range but concentrated toward the center, around 0.50.
Items with very high (0.90 or higher) or low (0.25 or lower) p-values should be given a qualitative review, even if you expect those results. An item that almost all students get correct (high p-value) may indicate that all students understand the material, but it could also mean the item was written in a way that clued students about the correct response. Or, it could simply be so easy that the score says very little about whether the content is fully understood. Similarly, an item that very few students get correct (low p-value) may mean the material is too difficult for their current level of understanding, but it could also reflect a poorly written item.
Interpreting Point-Biserial Correlations
The point-biserial correlation relates the scores students receive on a given item to the total scores that the students receive when summing their scores across all other items on the test. A high point-biserial correlation indicates that (a) students who got the item correct also scored high on the test overall, while (b) students who got the item incorrect scored low on the test overall. A low point-biserial correlation means that (a) students who did well overall got the item incorrect, and (b) students who did less well overall got the item correct.
A rule of thumb for reasonable point-biserial correlations is that they should be above 0.15, though our experience has shown that “good” items have point-biserial correlations of 0.25 or higher. A point-biserial correlation that is close to zero or negative often means that the key is incorrect, but other problems might also be present. For example, there may be multiple correct responses.
Items with low point-biserial correlations must be given a careful qualitative review because it is not logical that students who did well overall should get an item wrong that students who did not do well overall got correct. Something in the wording, presentation, or content may help explain the low correlation. Even if no obvious explanation for the low correlation is found, problematic items should be removed from scoring and future testing. Such items do not contribute consistent information about what students know.
Interpreting P-Values and Point-Biserial Correlations: Some Examples
Ideally, test items have both a p-value within the desired range and a relatively high point-biserial correlation. That is, each item has a reasonable level of difficulty (given the test purpose), and it discriminates between students who know the material well and those who do not. There is, however, no necessary relationship between the p-value and the point-biserial correlation. The point-biserial correlation should be used to assess item quality; the p-value should be used to assess item difficulty.
Our fictional classroom assessment provides examples of how to interpret item statistics. Assume this is a short summative assessment made up of multiple-choice and true/false items and administered at the end of a teaching unit to determine whether the students understand the content in that unit.3
Figure 1 displays the student roster, item scores, p-values, and point-biserial correlations.4 The student names are listed in rows 3 through 11 of column A, and the item numbers are listed as the column headers (columns B through K) in row 2. All items are scored 0 if incorrect and 1 if correct. Each cell of the table contains the score that a student received on an item. For example, Isaac is the only student who got Item 1 wrong (score of 0 in cell B11).
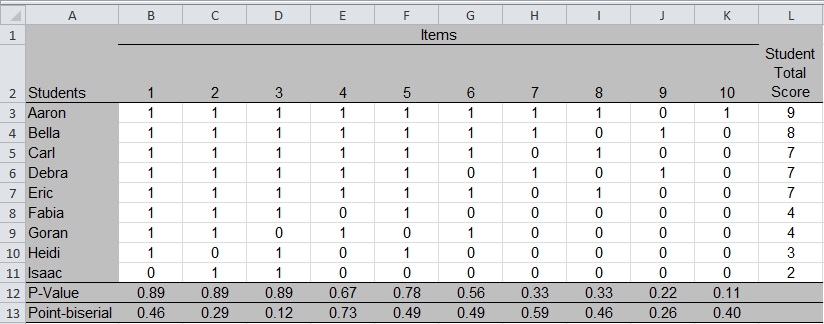
This is a highly stylized table with students conveniently listed in alphabetical order and in order of highest to lowest total scores, and with the items increasing in difficulty (p-values decline) from left to right in the table. The total scores would not seem “successful” from the point of view of the students, although they provide useful examples here. Classroom educators working with real data may wish to sort it by Student Total Score and rearrange items by p-value to see whether there are visible patterns in the item scores.
In our example data, Item 10 has the lowest p-value, 0.11; it is the most difficult item on the test. An examination of the item scores shows that only Aaron got it correct (score of 1 in cell K3). In column L, we see that Aaron had the highest score on the test, which is why the point-biserial correlation for Item 10 is above the problematic range (greater than 0.25). The item was very difficult for this set of students, but it differentiated well between the higher and lower performing students. The item statistics suggest that the teacher may wish to revisit the topic so other students gain a better understanding, but the item is not “bad” just because it has a low p-value.
The point-biserial correlation for Item 3 is low (0.12), even though it is one of the easiest items with a high p-value (0.89). Although most students found it easy, the point-biserial correlation indicates that something is problematic about this item. The item score matrix shows that Goran got Item 3 wrong, although he responded correctly to Items 4 and 6, both of which were more difficult as indicated by their lower p-values.
One explanation is that Goran guessed on Items 4 and 6, and he got lucky in guessing the correct responses. If, however, Goran did not guess and actually did answer Items 4 and 6 correctly, it suggests that Item 3 might measure something different from the rest of the test, at least for Goran. He was unable to answer an easier item (higher p-value), while getting more difficult items correct.
The example here is stylized, but in real life there may be a group of students like Goran for whom an item misbehaves. If we imagine a math word problem, the students for whom the item misbehaves may be English language learners. Or, we can imagine a vocabulary item that also measures background knowledge that some students might not have for whatever reason.
All items with low point-biserial correlations, regardless of their respective p-value, should be reviewed for content, wording, and potential bias. If an obvious problem can be corrected, the item may be revised and reused. If not, the item should be removed from future use as it provides confusing information with respect to what students know, even if many of them found it to be easy.
As a final example, note that Item 9 has both a relatively low p-value (0.22) and a relatively low point-biserial correlation (0.26). In the item score data, we see that only two students, Bella and Debra, got the item correct, and neither was at the top of the class in terms of total test score. An item with both a low point-biserial and a low p-value should be reviewed for content and wording. It may be that the content has not yet been covered in class or the response options are worded in a way that confuses students. Asking students about their responses would be helpful to the review process. The item statistics indicate some problem with the item that prevents it from contributing to meaningful test results.
Footnotes
1. We note that more sophisticated measures of item difficulty and discrimination can be computed using item-response theory models, but classical test theory tools give reasonable estimates and are accessible to educators who may have little training in psychometrics.
2. Computing an adjusted item mean (mean item score/maximum score possible) provides an estimate of item difficulty for constructed-response items, and the range is 0.0 to 1.0, but it does not convert to “percentage correct.”
3. Assessments are often classified as formative (assessment for learning, often ungraded) or summative (assessment of learning), but they may serve both purposes. See, Susan M. Brookhart, “Developing Measurement Theory for Classroom Assessment Purposes and Uses”
4. See Part 2 for how to compute p-values and point-biserial correlations. A report from a digital learning management system might show actual responses (A, B, C, or D; T/F) with the correct option in color or circled. Behind the scenes, the software will translate that to correct/incorrect scores based on the provided answer key.